Archive for the ‘Startup Investment Analysis’ Category
Busting More VC Myths With Data
Regular readers know that I’ve been trying to bust the “Seed Bubble” myth for years. In my latest analysis, I show that total seed funding in 2014 was nearly identical to that in 2008, not even adjusting for inflation or economic growth. Over the last year, I’ve encountered several other persistent VC myths that similarly conflict with the data. Given that the seed bubble meme seems to be subsiding (though I dispute talk of a nonexistent bubble “popping”), I thought I’d tilt at some of these other windmills.
Myth 1: Series A Crunch
The easiest target is the myth of the “Series A Crunch”. As far as I can tell, the first mention of this hypothesis was in a November 2011 blog post by Elad Gil. After a year of bouncing around the echo chamber, this November 2012 Pando Daily article by Sarah Lacy was pretty typical: “Everyone — to a person — says it’s a real phenomenon…That means we’re getting a very different ‘nuclear winter’ as a result of industry excesses this time around.”
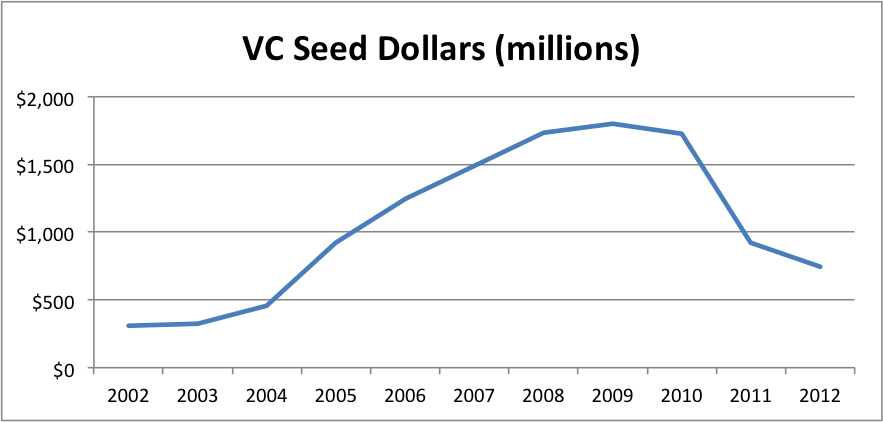
OK, so let’s look at the data on Early Stage VC dollars and deals from the NVCA. 

Hmm. I’m having trouble seeing much of a “crunch”. Pretty much up and to the right since 2009. Perhaps a slight valuation correction from 2011 to 2012, but deal volume was still going up. Certainly not a “nuclear winter”. Basic version of the myth.. busted.
Myth 2: Seed – Series A Imbalance
But there’s a variant of the Series A Crunch argument that the real problem is a Seed – Series A Imbalance. It’s not the absolute amount of Series A activity, rather there’s an overhang of increased Seed activity that is/will be causing a shortage of Series A down the line. Both the aforementioned Gil and Lacy pieces presage this twist. But this March 2015 Fortune article says it all in the title, “Free-flowing seed capital is giving startup founders a false sense of confidence,” and subtitle, “And it’s causing chaos ahead of the Series A round.”
Now, if you’ve read my Seed Bubble posts, you know that seed capital has not been “free flowing” over the past few years. But even I was shocked at the stark reality when I overlay VC Early and All Seed funding on the same graph.
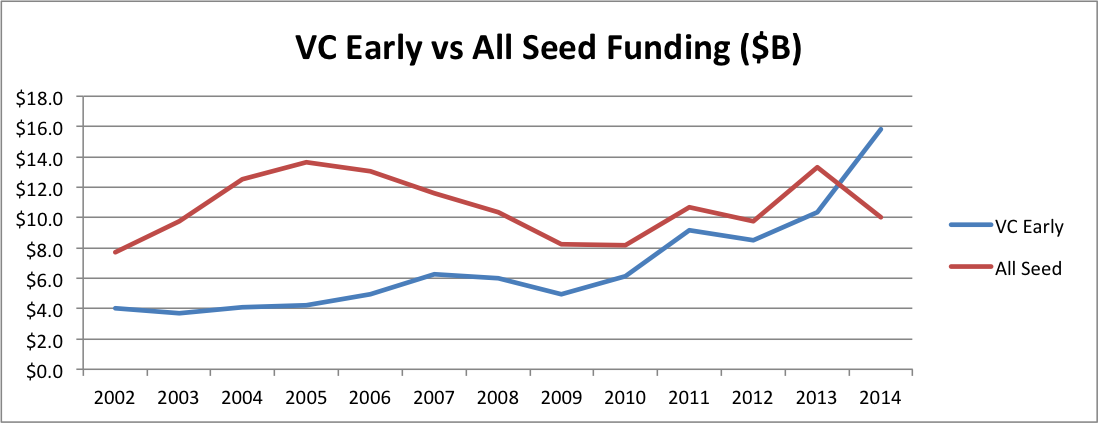
For a long time, seed funding was much greater than VC Early funding–twice the size or more. Then VC Early started to creep up. During the period of the supposed “Series A Crunch”, VC Early funding was actually shooting up from about 10% less to 60% more than All Seed. In fact, the ratio of VC Early to Seed tied the all time high in 2011 when the crunch supposedly began, then nearly doubled that record by 2014. If there’s an imbalance by historical standards, it’s the opposite direction!
Myth 3: “I’m Allocated to Seed”
Obviously, if people managing investment portfolios believe the Series A Crunch or Seed – Series A Imbalance myths, they won’t allocate dollars across startup stages correctly. This trap is compounded by a misimpression of the stages themselves. Many investors believe they are allocated to “seed” when in fact they have only fractional exposure to “something VCs call seed but is vastly different from the rest of the seed market.” From an allocation perspective, misidentifying your asset classes is a huge danger.
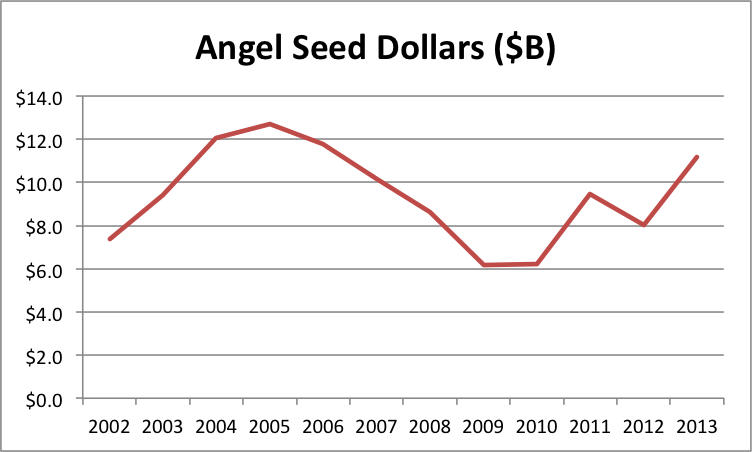
In my opinion, what VCs call seed is not the same as the rest of the market. Just look at the average size of a VC deal vs the average size of an angel deal. (Note that the angel number is the average size of at all stages so the graph actually understates the difference at the seed stage; unfortunately, CVR tracks angel deal volume, but not deal size, by stage.)

The ratio rose from about 4X in 2002 to 11.5X in 2014, with a peak of 14.5X in 2009. There’s clearly a categorical difference between what VCs and angels call seed.
Moreover, if you invest in an early stage VC fund, at best a modest fraction of each dollar actually goes to seed. Most early stage VCs make only a small subset of their initial investments at the round they call seed (unsurprisingly, most of the money goes into the round they call “early”). Moreover, even funds who always make their initial investments at what they call seed generally reserve at least $1 of follow-on for each initial $1. So at absolute best, investors who think they have seed exposure through VCs are getting half their dollars exposed to only the tiny slice of the seed market that accounts for the largest deals.
The share of this very high end of the market dropped precipitously in 2011.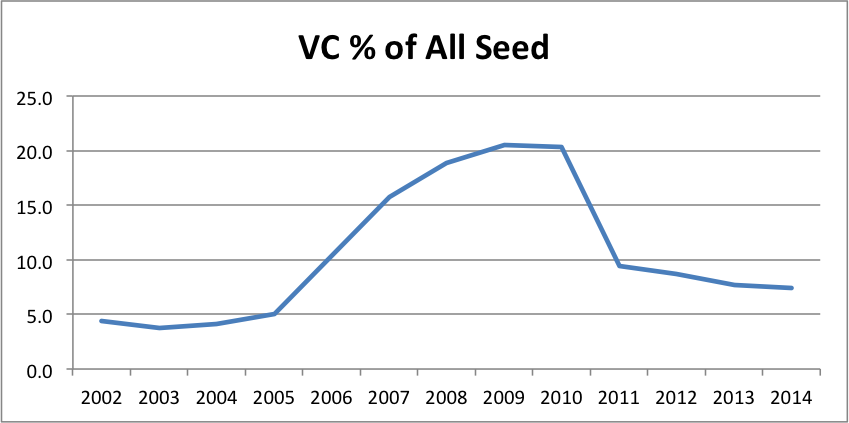
In my opinion, the combination of all these factors means most investors in funds are dramatically under-allocated to over 90% of the seed stage technology startup market–a market that’s roughly the same size as the Early Stage VC market.
Does this difference matter? Well, if you’re worried about portfolio allocation to illiquid assets, you should be pretty concerned about the future liquidity options for such assets. From that perspective, here’s a sobering statistic from CB Insights (secondary source because primary requires registration):
In 2014, 73% of technology companies acquired never took traditional VC.
So if you believe that that VC Seed gets you exposure to the entire seed stage startup asset class, your portfolio will lack exposure to 3/4 of the liquidity options. By the way, this statistic is up from 2/3 in 2013. And with record amounts of cash on the large technology company balance sheets that make these acquisitions, I could easily see this bias growing further. Imagine a portfolio that lacks exposure to 80% or 90% of the liquidity events in that asset class! This third party data dovetails nicely with my previous calculation of a massive difference in the small M&A vs IPO and large M&A market.
I will stipulate that the VC-backed exits are almost certainly each bigger. But the goal of portfolio allocation is to balance out risks within and across asset classes. The data makes it clear that relying on VC Seed leaves a portfolio exposed to idiosyncratic risks within a particularly narrow exit market. So finding some way to target the other 90% of the seed stage technology startup market seems like prudent portfolio construction.
Of course, there may be different data out there or I may have botched the crunching somehow. So as always, feel free to check the work on my spreadsheet.
Full Year 2014 “Seed Bubble” Update
According to my usual data sources, 2014 was not nearly as good a year in seed funding as I would have expected from reading news reports. I was fully prepared to see “bubbly” data. However:
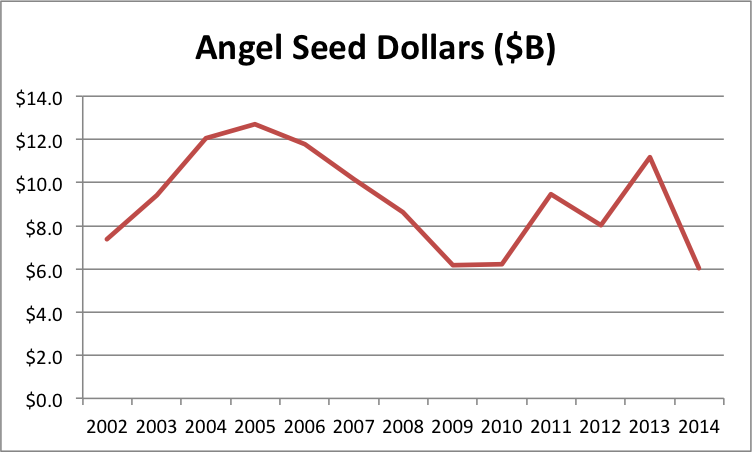
- From angels, seed stage funding plunged nearly 50%, from $11.2B to $6.0B.
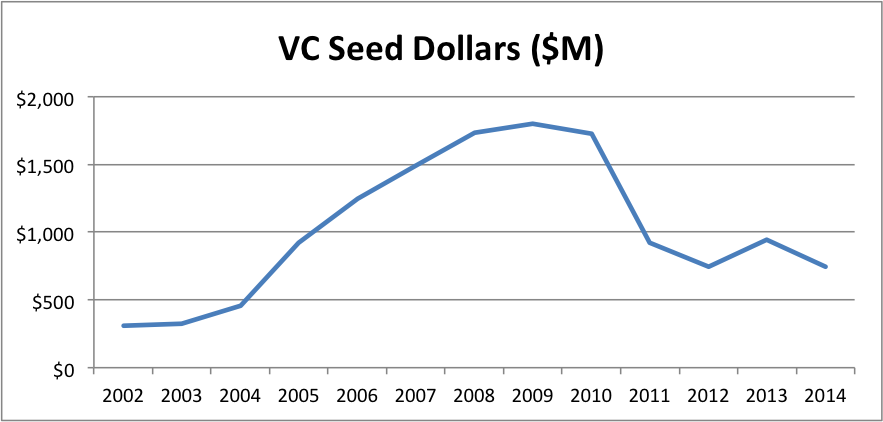
- From VCs, seed stage funding dropped about 25%, from $940M to $740M.
(While VC early stage jumped over 60% and expansion stage spiked over 110%.) - But median seed valuations increased 20%, from $2.5M to $3.0M.
The run up of a bubble does not typically include sharp volume drops, but the price rise may indicate something interesting is going on.
See here, here, here, here, here, here, and here for previous posts in this thread. My data sources are the Center for Venture Research for angel data, the NVCA for VC data, and my personal tracking spreadsheet for “super angel” funds not part of the NVCA. I use the HALO report for pricing data.
Out of concern that one possible explanation for individual angel investments dropping is a shift to angel funds, I reconstructed my angel fund tracking spreadsheet from scratch. I was worried that my list of funds was too haphazard. So I pulled a longer, hopefully more complete, list of micro VC firms from CB Insights. I then removed ones that are members of the NVCA, whose investments should already be included in that data. I also went through fund CrunchBase listings and Web sites, filtering out those who invest primarily outside the US or not at the seed stage. I noted the reason for any such exclusions in my latest spreadsheet. This updated source contains 74 funds totaling $3.2B, while my 2013 source contained 29 funds totaling $1.2B—a substantial increase in coverage. There were also 23 funds on the new list for whom I could not find dollar amounts. However, I assume each fund with dollar amounts is completely deployed in the current year so the total should still be a gracious estimate given that even very fast funds actually deploy over two or three years.
Despite the addition of $2B in covered super angel investments, the 2014 graphs were still sobering with a 25% total volume drop year-over-year:

The big question is how do you get a pronounced volume drop and a pronounced price increase? First, one of the data sources could have a problem. The obvious candidate here is the CVR angel data because it accounts for most of the total volume I track, the methods aren’t documented, and this is its biggest one-year drop ever. According to the latest report, total angel investment volume was only down 2.8%. But the proportion of seed and early investment plummeted from 45% to 25%. I can think of several reasons for a potential measurement inconsistencies here. Note that the 2012 measurement was 35% so it has a lot volatility.
Similarly, the CB Insights pricing data could be the result of an anomaly, as it also experienced its biggest one-year move. In contrast to CB Insights’ 20% jump in valuations, the CVR valuation data showed a slight decrease across all stages (but the CVR valuation data is reported inconsistently, so I have avoided using it in the past). Of course, the CB Insights and CVR data collection methods could somehow result in systematically different samples that explain the conflicting data.
There’s another explanation that I find tantalizing, if only because it would confirm my hypothesis that founder opportunity cost drives the earliest company valuations. Think of seed stage companies as “supplying” investments and investors “consuming” them. Econ 101 says that a simultaneous decrease in volume and increase in price implies that the supply curve has shifted left. It’s like a freeze wiping out a significant fraction of the orange crop. People buy less at higher prices because there’s a shortage. But why would this happen now in the seed stage startup market?
I have a guess: the macroeconomy recovered. Unemployment eased from 7.5% in June 2013 to 6.1% in June 2014. Moreover, according to Indeed.com, software engineering salaries jumped 20% in 4Q2013. All of a sudden, the opportunity cost of founding a seed stage startup went up dramatically. That could definitely have an effect on formation rates, which would show up first in the seed stage funding data. Another “supply side” explanation would be that founders simply need less money to advance their ideas past the seed stage. The total number of angel-funded deals actually went up 3.8% according to the CVR report.
At RSCM, we’ve certainly seen no shortage of quality opportunities at low valuations. If anything, we are deluged. Of course, we purposely focus on smaller deals so we wouldn’t expect to see any shortage if lower capital requirements were the underlying cause. Our experience is also consistent with a data collection anomaly. I’d love to get my hands on a good dataset for accelerator program application volume. That might allow us to distinguish between declines in formation rates and capital requirements.
Bottom line: I’m still very skeptical that there is a seed stage bubble.
Full Year 2013 “Seed Bubble” Update
So there are finally some signs if life in seed-stage technology funding:
- In nominal terms, we roughly equaled the global peak from 2005.
- Seed stage valuations have remained flat since 2011.
- Adjusting for the size of the economy and our wealth, the level is still down.
Kind of hard to call this situation a “bubble”. But I can live with calling it a “recovery”.
Once again, see here, here, here, here, here, and here for previous posts in this thread. My data sources are the Center for Venture Research for angel data, the NVCA for VC data, and my personal tracking spreadsheet for “super angel” funds not part of the NVCA. For super angel investment, I worry most about detecting new chunks of money, not necessarily measuring the “true” level. I use the HALO report for pricing data, which goes back to 2011.
Here are the graphs (spreadsheet here):


It looks like all the components are recovering, though traditional VC somewhat more slowly and super angel somewhat more quickly. The question is still, “Bubble or no bubble?”
Let’s look at prices, as I did in my 1H2013 post. According to the full year 2013 HALO report, the median seed valuation is still $2.5M… just like 2012… and 2011. The 75th percentile valuation is up slightly in 2013, from $3.7M to $4.2M. But the 25th percentile valuation is down a hair from $1.5M to $1.4M. According to the methodology described in the report, this data includes angel group deals before Series A. So what I think is happening is that some companies that might have gone for a VC round in the past are doing a larger angel round instead. If you check out my spreadsheet, you can see that check sizes for what the NVCA calls “seed” have taken another swing up, probably pushing some early startups out of that market. So no obvious pricing pressure.
Moreover, I think the following graphs make a bubble quite unlikely. I’ve been waiting for years to pull these out. The first one “deflates” the seed investment levels by adjusting for GDP. Thus it measures how seed investment has changed relative to total economic output. The second one deflates seed investment levels by adjusting for the level of the S&P500 index (on July 1 of the given year). Thus it measures how seed investment has changed relative to the total stock of wealth.
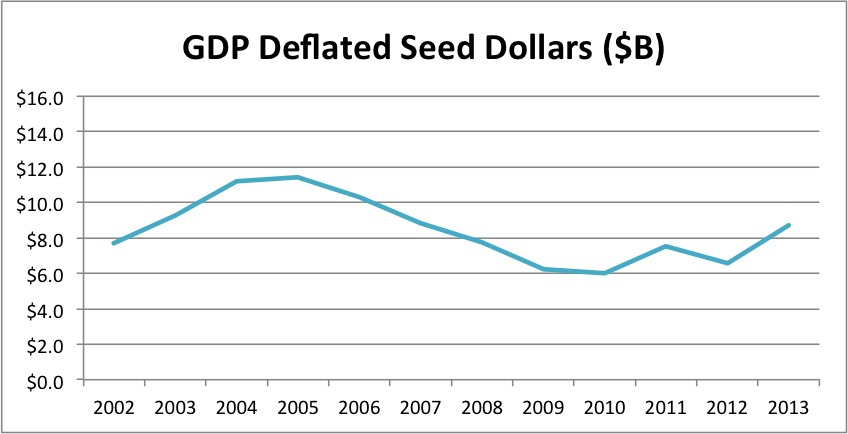

Compared to our economic output and total wealth, seed-stage investment seems like it still has a significant amount of headroom. I’m actually pretty sure I could build a darned accurate forecasting model based mostly on the S&P. Given that the index is up roughly 25% from July 2013 to July 2014, my eyeball estimate is that 1H2014’s numbers will show us somewhere around a $16B annual rate.
Seed Bubble Watch 1st Half 2013
Well, it’s been almost three years since I started watching for quantitative evidence of a “bubble” in seed-stage technology funding. I feel like a broken record saying there’s still no sign. Here are the highlights:
- 1H2013 volume is 30% below the 2005 global maximum
- 1H2013 volume is 10% below the 2011 local maximum
- Seed stage valuations have been flat since 2011
You simply don’t have a bubble when volume is down and prices are flat!
To review the history of my seed bubble watch, see here, here, here, here, and here. Recall that I use the Center for Venture Research’s angel data, the NVCA’s VC data, and my personal list of “super angel” funds not part of the NVCA. The volume calculation methodology is not designed to produce the most accurate estimate of the true number of seed-stage dollars. Rather, I want it maximally sensitive to sudden influxes in new seed money. I use the HALO report for pricing data, which started coming out in 2011.
That said, here are the graphs (spreadsheet here):


The story continues to be that traditional VCs have become increasingly irrelevant as their seed dollars have dropped 60% from 2009 to 1H2013 and their share of all seed dollars has plunged from 22% to 7.5%.
Angel’s position has gradually eroded from 2011 to 2013, with their share decreasing from 88% to 77%. Super angels and seed funds have gained in share during that time, jumping from 3.0% to 15%. My guess is that trend will continue unless the individual angel pool increases via new platforms like AngelList. In any case, the new breed of funds is not growing fast enough yet to make up for decreases from other sources.
[Edit 8pm: Somehow this paragraph got deleted from my draft.] There also appears to be no pricing pressure at the seed stage. According to the 2012 and 2Q2013 HALO reports, the median seed-stage pre-money valuation has remained $2.5M since 2011. Moreover, the 25th and 75th percentile valuations have actually decreased, making it hard to argue that there is some hidden dynamic masking a buildup in prices.
Interestingly, the HALO report shows a continued drop in California’s share of angel group activity. From 21.0% in 2011, to 18.1% in 2012, to 17.3% in 1H2013. I’ll take this as continued confirmation that RSCM is right that some of the best values are outside the Bay Area.
It will be interesting to see what the data shows for 2H2013 and 1H2014. With the S&P reaching new highs throughout 4Q2013, institutions should increase their allocations to alternative investment funds and angels should feel like they have more wealth to invest in startups. Assuming the public markets don’t experience a sudden drop in the beginning of 2014, of course.
Full Year 2012 “Seed Bubble” Update
As regular readers know, I’ve been on the lookout for a bubble in seed stage investing. After two years, still no sign. In fact, I’d say that we may be falling somewhat behind. If so, hopefully Right Side (my fund), 500 Startups, and others like us can help plug the gap.
To review the history of my seed bubble watch, see here, here, here, and here. Recall that I use the Center for Venture Research’s angel data, the NVCA’s VC data, and my list of “super angel” funds not part of the NVCA. The methodology is not designed to produce the most accurate estimate of the true number of seed-stage dollars. Rather, I want it maximally sensitive to sudden influxes in new seed money.
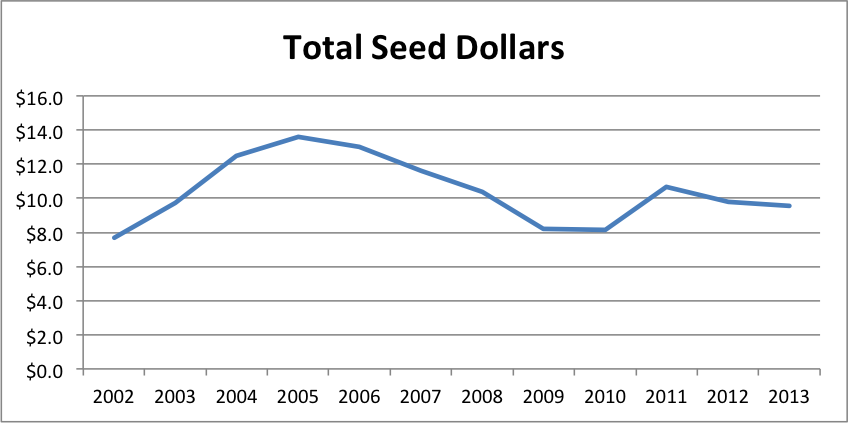
That said, here are the graphs (spreadsheet here):

Total seed dollars are down slightly from 2011, driven by surprising weakness from angels and continued erosion from VCs. At least it’s not quite as bad as the data from 1H2012, which was at an $8.7B/yr pace instead of the $9.8B we actually saw for all of 2012.
The angel data is interesting. (I have to say that because my prediction of $10B of angel seed for 2012 was wrong.) Total angel investment across all stages was actually up very slightly at 1.8%. But the share deployed at the seed stage dropped pretty dramatically from 42% to 35%. Initially, I was troubled. If angels were pulling away from the seed stage faster than new sources were coming on line, we could actually end up with a seed stage “crunch” rather than a bubble. So I decided to investigate further.
I went to the HALO report, a joint product of the Angel Resource Institute (funded by the Kauffman Foundation), Silicon Valley Bank, and CB Insights. This report does not provide an estimate of total angel volume. However, it does track some key statistics of investments by angel groups. According to this source, the mean and median round sizes didn’t change much from 2011 to 2012. Mean up 10%, median down 4%. Pre-money valuations were exactly the same, with a median of $2.5M. So it appears that angel groups are making pretty much the same kinds of investments in 2012 as they did in 2011.
My guess is that the difference in angel seed from 2011 to 2012 comes mostly from what angels mentally categorize as “seed” vs “early” in the CVR survey. I’m sure it randomly fluctuates a bit from year to year. But I think most of the explanation is that startups generally appear farther along, thanks to (1) the prevalence of incubators/accelerators (and the diffusion via the Internet of the lessons they learn) and (2) the decreasing time necessary to build products that receive initial market feedback.
The ecology is probably innovating faster than angels are adjusting their mental yardsticks of progress. So the share of angel dollars going to the earliest quartile of deals they see may not be changing. It’s just that improvements in infrastructure have allowed these young companies to make more progress before they approach angels.
Interestingly, the HALO report shows a drop from 21.0% to 18.1% in California’s share of angel group activity. Apparently, we at Right Side are not the only ones who believe that startups outside of Silicon Valley are a “good value”.
Note also that I added a new source for seed fund data. 500 Startups tracks small VC funds here. So I went down the list and eliminated all funds that were duplicates of funds I already track, members of the NVCA so already accounted for in that data, who invest solely outside the US, or whose investment focus is in a stage other than seed. In cases where there were duplicates with my existing data, I used whichever source had the highest fund size.
This new source added about $500M, or 5%, to the total. I guess if we’re going to keep up the seed numbers in the absence of strong economic growth, we need more of these small seed funds
Angel Investing: Diversification vs Skill
The data analyses from my last two posts, How Many Angel Investments? and What If the Angel Market Tanks?, have an important alternative interpretation. If you also read my earlier posts on diversification in general, Diversification Is a “Fact” and Even If You’re “Good” Diversification Matters, you may have an inkling of what’s coming. The punchline is:
For angels, diversification can be more important than skill…
(… at the margin, if all you care about is returns, and you have typical risk preferences.)
I know what some of you are thinking: “Oh, you’re one of those crazy ‘spray and pray’ guys who don’t think you need to learn anything about a company to invest in it. Don’t you know angel investing takes a lot of experience and time?”
Before you write me off as a loon, please give me just a few more seconds of your time. That’s not actually what I’m saying. There are some rather crucial nuances and disclaimers. Moreover, the analysis we’ve already done with the AIPP sample of actual angel investments clearly supports my nuanced and disclaimed position.
First, let’s reinterpret the “50% Complete Failure” scenario from the last post. Instead of looking at it as a possible future scenario for the angel market as a whole, let’s look at it as the possible future outcome distribution for a slightly different investing strategy, “Scalable Angel”.
This hypothetical strategy contrasts with the traditional investment strategy, “Custom Angel”. Using the Custom Angel strategy, individual angels and angel groups apply their substantial experience to perform a lengthy personalized screening and evaluation of each startup investment opportunity. While very thorough, this strategy is not very scalable. It requires years to develop the necessary skill and a considerable amount of time to apply.
The Scalable Angel strategy is based on the Custom Angel strategy. However, it eliminates many screening and evaluation tasks that can’t be boiled down to policies, templates, and heuristics. It still applies a lot of screening and evaluation. It even applies a fair amount of personalized attention. It just avoids the lowest-value and most time-consuming steps. While definitely more scalable, a lot of people may find it hard to believe that it could be as effective.
So for the sake of argument, let’s assume that it’s not nearly as good as the Custom Angel strategy and results in 50% more failed investments. The “Baseline 40% Complete Failure” scenario from the last post had 111 failures, while the “50% Complete Failure” scenario had 166, which is 49.5% more. So, conveniently, we can use the resampling of 50% Complete Failure to represent the outcome distribution for the Scalable Angel strategy.
Now, all we have to do is decide on reasonable portfolio sizes to compare. In the original Rob Wiltbank Tech Crunch article that kicked off this series of posts, he recommended “…at least a dozen investments…”. To give Custom Angel the benefit of the doubt, let’s use 15. My anecdotal experience is that a 15-investment portfolio would put an angel in the “very active” category. On the other end of the spectrum, RSCM (my firm) is aiming for 250 investments in its fund and, as Dave McClure so kindly contributed in the comments of the last post, 500 Startups will have about 250 investments per fund. But let’s again be conservative, so we’ll use 200 investments for our hypothetical Scalable Angel strategy.
It’s a simple mater to look at the last post’s spreadsheet and plot the probabilities of achieving different return multiples using the two strategies:

Due to our assumption of a much higher number of failures, Scalable Angel has a lower expected value, 3.66x vs 3.24x. But is sure looks a lot safer overall! Scalable Angel did not have a single losing portfolio out of 10,000 simulations while almost 8% of Custom Angel portfolios lost money. Scalable Angel has a whopping 24 percentage point advantage in doubling your money (95.17% vs 70.98%). Even at tripling your money, where its lower expected value starts becoming apparent, it has a 9 percentage point advantage (49.61% vs 58.32%).
What about those nuances and disclaimers? Well, Scalable Angel certainly does not assume we can costlessly eliminate screening and due diligence. It assumes we can either streamline or find streamlined substitutes for many, but not all, aspects of screening and due diligence. For those we can’t, it assumes we pay a pretty hefty penalty of 50% more complete failures.
Also, it assumes that angels are interested only in overall returns. Individual angels and angel groups may be legitimately concerned with the failure rate. If part of why you like being an angel is the feeling you get from helping a company succeed, I would certainly understand wanting to maximize the number of successes even if that resulted in greater financial risk (especially if you were risking a very small fraction of your overall wealth). On the topic of risk, our conclusion further assumes angels are willing to sacrifice a bit of return on the high end for a much lower chance of suffering outright losses or even under-performing the public equity market. While individuals certainly differ, the empirical literature on risk preferences (nicely summarized here) supports this assumption for typical investors.
On the other hand, our current analysis also ignores some likely additional advantages of the Scalable Angel strategy. First, when you make a process more systematic, you usually reduce per unit costs. The AIPP data, indeed angels in general, do not track investment costs very precisely. My anecdotal experience is that a fair accounting of angel out-of-pocket and labor expenses would put them at a noticeable fraction of the dollars they invest. By ignoring these expenses, the AIPP data overstate the return of the Custom Angel strategy. Like any high-efficiency process, the Scalable Angel process would probably cut these costs dramatically, increasing its true relative return.
Moreover, high-volume processes tend to be more measurable than custom ones. Greater measurement leads to greater optimization. That’s the point of the whole “Big Data” trend! So even if the Scalable Angel strategy were initially less effective, over time, I bet it would close the gap in the expected failure rate, probably eventually surpassing Custom Angel.
Finally, I don’t think Scalable Angel would actually have a substantially worse outcome distribution. If you saw Moneyball, you know that some relatively simple metrics outperformed all those experienced baseball scouts performing their individual player evaluations. In this old post, I present the strong empirical evidence against individual’s ability to predict success when a startup launches. Now, ongoing individual attention probably provides some benefit to a startup’s development. But in practice, RSCM and 500 Startups provide quite a bit of this type of guidance. If you performed a detailed comparison of this assistance vs the typical active angel’s assistance, I think it would be hard to argue that the difference would lead to 50% more failures.
So I think it’s pretty safe to say that our hypothetical Scalable Angel outcome distribution is an extremely conservative comparison to past practice. And it still clearly outperforms in terms of risk-reward. From the perspective of angel investments as investments, the evidence strongly supports scalable approaches as a competitive option.
[Updated 4/25/2013: corrected minor error in spreadsheet and graph.]
What If the Angel Market Tanks?
In my last post, I showed how diversification helps an angel portfolio get closer to the true underlying return of the market. Based on the AIPP’s historical sample of angel-backed startups that meet RSCM‘s investment criteria, we saw that 70 investments would have given you a ~90% chance of doubling your money and 200 would have given you an ~80% chance of tripling your money.
Of course, almost everyone has heard the disclaimer, “Past performance is no guarantee of future results.” We don’t really know that angel investments made today will have the same outcome distribution as those made in the past. No amount of statistical wizardy can change that. However, the resampling technique I used in the last post does reveal how a diversified portfolio can provide some protection against losses if the angel market tanks.
Let’s call a “complete failure” an investment that loses more than 50% of the original capital. Under that definition, the original sample has almost exactly a 40% failure rate: 111 out 277 investments.
So let’s adjust our resampling procedure to simulate different rates of failure in the future. By simply adding in extra copies of the 111 “completely failed” investments, we can see what happens with 50%, 60%, and 70% failure probabilities. Obviously, expected returns decrease as failures increase. But what about the chance of overall loss? Does diversification protect us?
First, let’s refresh our memories with a graph of how different portfolio sizes fare under our baseline scenario of 40% complete failures. Note, that I’ve extended the maximum portfolio size analyzed to 500.
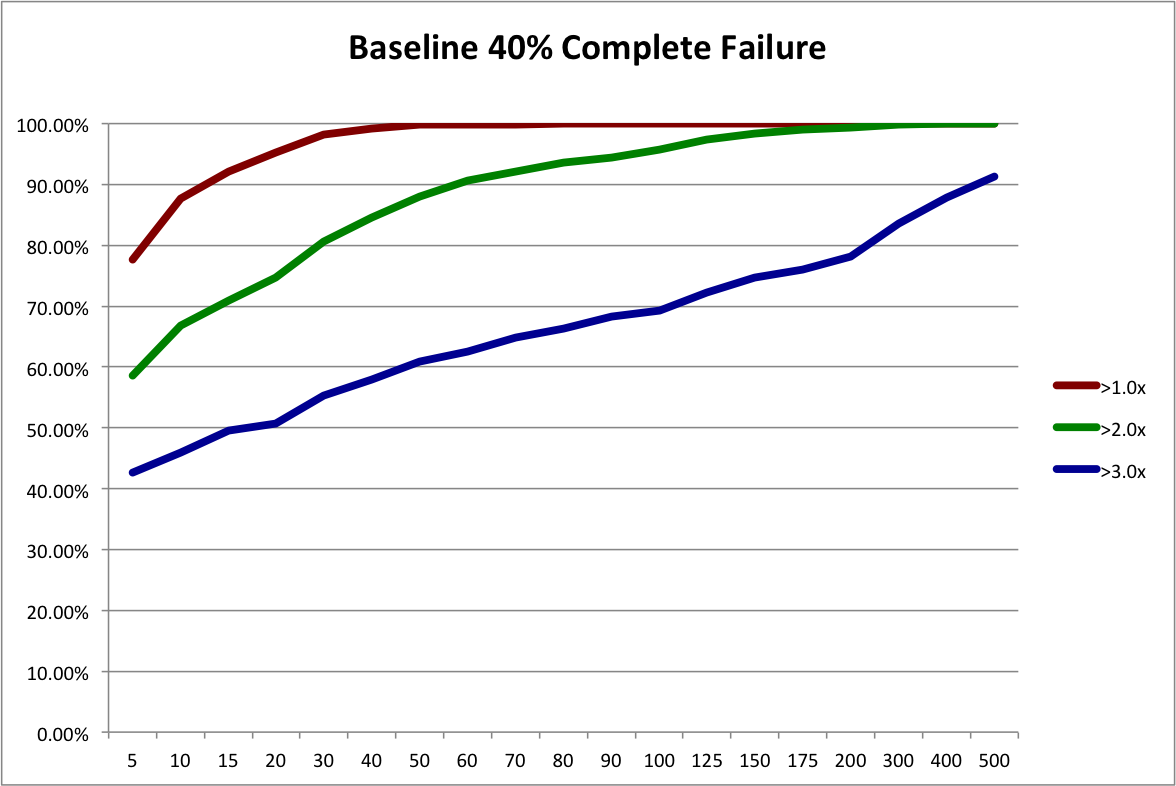
To simulate a 50% failure rate in the future, we start with our baseline sample and add 55 duplicate records of complete failures to create a new sample with a somewhat worse outcome distribution. That makes the failure rate (111+55) / (277+55) = .50. The expected payout is now 3.24x instead of 3.66x. Then we run the resampling procedure on the new sample. The next graph shows the resulting probabilities of achieving 1x, 2x, and 3x the original investment.
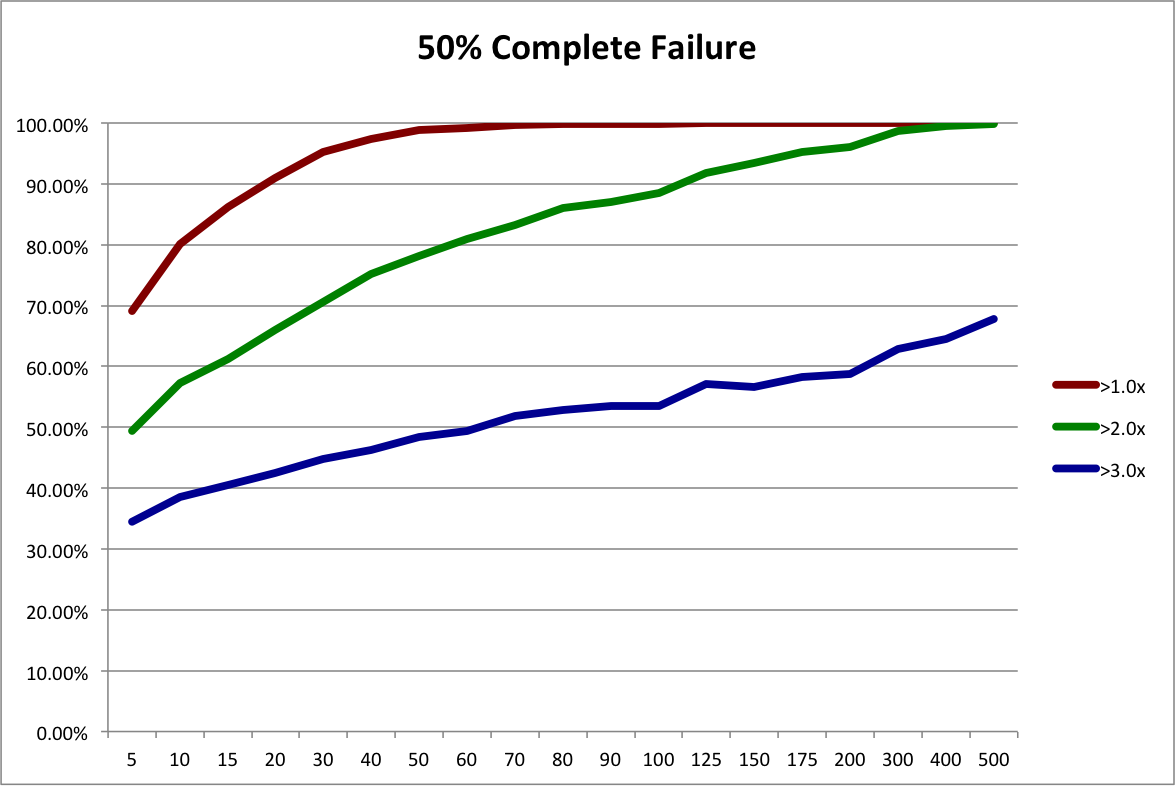
Still not too bad. We’d almost certainly double our money and have a decent chance of tripling. What happens if the angel market really tanks? By adding in more copies of complete failures, we can simulate 60% and 70% failure rates. Expected payouts drop to 2.68x and1.97x, respectively. The next graphs present the probabilities of 1x, 1.5X, and 2x outcomes for these scenarios. 3x is such a remote possibility, I’ve left it out and put in a 1.5X line to give us better resolution.

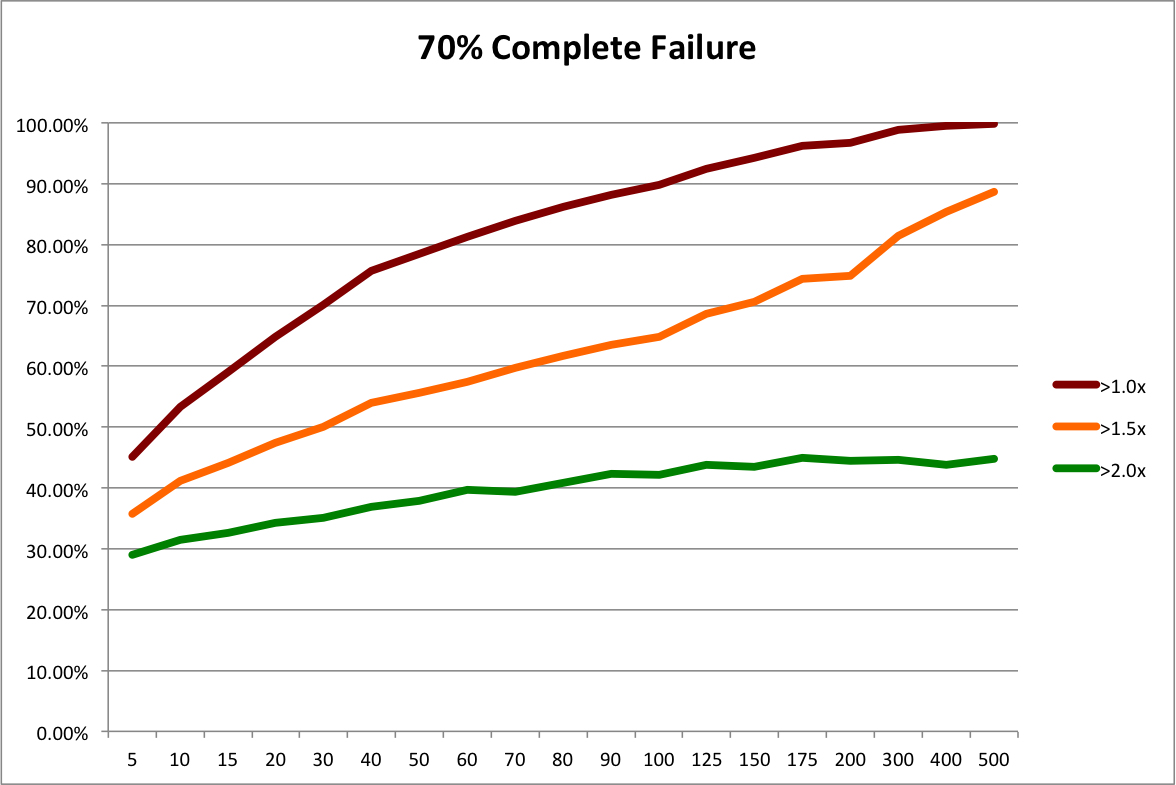
60% failures isn’t too bad. We can still drive the chance of doubling our money above 90% with 500 investments. 70% complete failures sucks. Especially when you look at it from the perspective of homeruns. Remember that big winners drive returns. If a “homerun” is any investment with at least a 10x return, adding in all the complete failures drops the percentage of homeruns from from 7.6% in the baseline to 3.8% in the worst case. So in some sense, the market is only half as good. Even then, a portfolio of 200 investments has less than a 5% chance of losing money and a portfolio of 500 investments has less than 1% chance. Diversification still provides decent protection.
Also consider that the most likely cause of such an awful angel market would be macro events that affect the entire economy. The NASDAQ and S&P 500 would probably not be doing well either.
I think this analysis shows that diversification is a good idea even if you think the future angel market may fluctuate. This conclusion isn’t at all surprising. Fundamentally, diversification reduces volatility. If you think the future market might differ from the past market, that means you believe the market is more volatile. Therefore, diversification is actually more important.
[Note added 4/3/2013: here is the Excel file I used for these simulations.]
[Updated 4/25/2013: corrected minor error in spreadsheet and graphs.]
How Many Angel Investments?
As regular readers know, I’m a huge fan of the AIPP data set collected by Rob Wiltbank. In this TechCrunch article from a while back, Rob corrected the mistaken assertion that angels don’t make money. He also said that, “Angel investors probably should look to make at least a dozen investments…” While this statement isn’t wrong, neither is it as nuanced as I would like.
In this previous post, I used simulated data to examine the issue of adequate diversification. As it happens, I’ve also privately analyzed this issue using Rob’s AIPP data, an analysis I will now make public. [Hat tip to Paul P, a colleague with a professional financial statistics background who inspired and reviewed the original analysis, though any mistakes remain mine.]
To achieve my fully nuanced answer, I need to address two issues. But I’ll devote separate posts to each issue. This post addresses the issue that diversification is a tradeoff. More diversification will always protect you slightly more from idiosyncratic risk, all other things being equal (see my diversification posts one and two). But diversification isn’t free. It’s harder to make 10 investments than 1, and harder still to make 100. As an investor, you want to know how much each additional investment reduces idiosyncratic risk so you can make the right tradeoff for you.
To demonstrate this tradeoff, I’ll focus on RSCM‘s particular investing strategy: seed stage, no follow on, technology sector. I documented how I applied this strategy to the AIPP data set, complete with filtered data file, in this post. In principle, you could create a filtered data file for your own strategy as described in this other post and then apply the procedure below to calculate the precise diversification tradeoff for your strategy.
The key to the whole problem is a statistical technique called resampling; I’ll take the records from my filtered data file and create 10K portfolios for a variety of portfolio sizes, using random sampling with replacement. Then it’s straightforward to determine how much the historical returns at each portfolio size could vary. Essentially, we’re performing the following thought experiment: what if 10K angels randomly invested in the startups that Rob studied? What if they each invested in 10, 20, 30,… companies? How likely would a given angel have been to achieve a given return?
The return for the entire sample is a 42% IRR and a 3.7x payout multiple. The graph below shows the probability of achieving at least 1x, 2x, and 3x the original investment for a range of portfolio sizes. [Excel file with data, sampling macro, and probability macro is here.]

Now you can see the diversification tradeoff. Personally, I think a bare minimum is a 90% chance of getting at least your money back. That’s 15 investments based on the historical data. Roughly the same as Rob’s answer of a “dozen”. But I’d really prefer a 90% chance of doubling my money. That’s 70 investments. Now, if I’m managing other people’s money, I’d really like to push to an 80% chance of tripling their money, which is over 200 investments. I didn’t run 400 investments, but I’m guessing that is roughly the point at which you would have had a 90% chance of tripling other people’s money. [Update 4/2/2013: after doing a bunch or runs, it looks like it takes over 500 investments to achieve a 90% chance of tripling.] As far as I know, 500 Startups is the only firm other than RSCM that is even shooting for that level of diversification in a single portfolio.
So there’s my take on the first issue, diversification as a tradeoff. The second issue is essentially the old problem of, “Past performance is no guarantee of future results.” What if the return distribution of seed stage technology startups is different going forward than during the period Rob collected data? It turns out there’s a nifty way to use resampling to test the sensitivity of different levels of diversification to shifts in the return curve. That’s the topic of the next post.
[Updated 4/25/2013: corrected minor error in spreadsheet and graph]
Seed Bubble Watch 1st Half 2012
Yes, it’s time for another edition of “Seed Bubble Watch”. The subtitle for this round is, “Still Waiting to Inflate.”
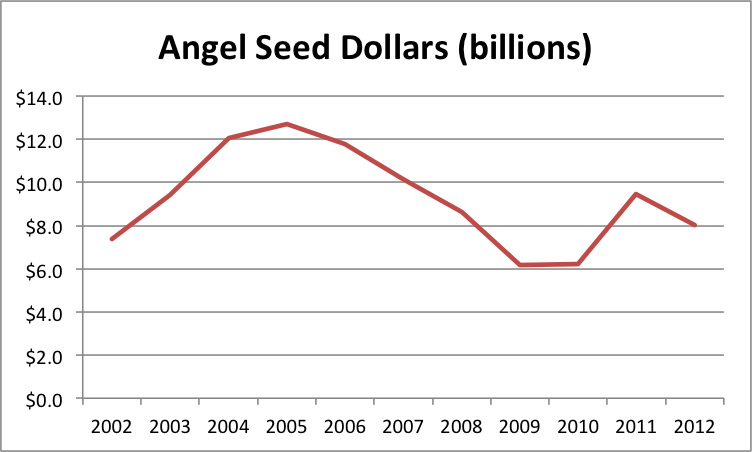
For notes on sources and methods, see my previous posts in the series here, here, and here. Current spreadsheet is here. Now to the money charts:


The first chart shows a slight dip back towards 2009 and 2010 levels. However, I think this is an artifact of seasonality in angel investing. Comparing 1H2012 to 1H2011 for the angel data, there’s actually an increase of 7% from a $6.9B annual rate to a $7.4B annual rate. It’s just that 2H2011 had a $12.1B annual rate. I know of nothing specific that happened in the second half of last year to account for a spike, so my guess is that angel activity is just generally higher July through December. My prediction is that when the full year 2012 numbers come out in April 2013, we’ll see 2012 angel investing at slightly over $10B.
Reported VC seed stage investing continues to drop (with my standard caveat that what VC’s call “seed” is probably different from angels). But it was made up for by increases in the size of super angel funds. The obvious explanation is that super angels are taking over part of the VC seed function. I think there’s more to it than that, but substitution and specialization are certainly part of the story.
Recall that I aggressively assume super angels deploy all their dollars in one year, to make my synthesized investment metric maximally sensitive to detecting bubbles. It looks like this assumption may not be too far out of line with reality. Aydin Senkut’s Felicis Ventures is raising a $71M fund after a $40M fund in 2010. Mike Maples’ Floodgate is raising $75M after $70M in 2010. Lerer Ventures is raising $30M after $25M in 2011. Ron Conway’s SV Angel is raising $40M after $28M in 2011. Chris Sacca’s Lowercase Capital is raising $65M after $28M in 2010. And finally, our big winner is Thrive Capital, raising $150M ($147M of which was already in the door as of 9/6/2012) after $40M in 2011. Given IA Ventures‘ big raise noted in our last installment, we’ve got two NYC new media funds blowing up. And it seems like a lot of the leading funds are on a 1-2 year cycle.
I think this data supports my previous assertions that there is no general seed bubble in the US. However, it certainly seems plausible that Silicon Valley and NYC could have local bubbles given the increasing dollars going into super angel funds in those areas and anecdotal reports of high valuations. But my ad hoc conversations with people at the super angels indicate they are investing in a wide variety of locations. It’s possible that, at the margin, angels and super angels are choosing to invest outside of Silicon Valley and NYC often enough that we’ve reached an equilibrium.
For the rest of 2012 and all of 2013, I think the big driver will be the overall economy. GDP growth was only 1.3% in the 2nd quarter and 2.0% in the 1st quarter. The 20-year average is 2.5%. So I don’t expect a big increase in seed funding until we at least get above that rate.
Valuing Seed Stage Startups
One of the questions I most frequently answer about RSCM is how we value seed stage startups. Apparently, being not only willing, but eager to set equity valuations sets us apart from the vast majority of investors. It’s also the aspect of our approach that I’m most proud of intellectually. Developing the rest of our process was mostly a matter of basic data analysis and applying existing research. But the core of our valuation system rests on a real (though modest) insight.
We’ve finally accumulated enough real-world experience with our valuation approach that I feel comfortable publicly discussing it. Now, I’m not going to give out the formula. Partly, this is to preserve some semblance of unique competitive advantage. But it’s also for practical reasons:
- Our precise formula is tuned for our specific investment theses, which are based on our larger analysis of exit markets, technology dynamics, and diversification requirements.
- The current version of the formula doesn’t communicate just how adaptable the fundamental concept is (and we do in fact adjust it as we learn).
- There’s a lot of truth in the wisdom about teaching a man to fish rather than giving him a fish.
Instead, I’m going to discuss how we constructed the formula. Then you can borrow whatever aspects of our approach you think are valid (if any) and build your own version if you like.
The first part of our modest insight was to face the fact that, at the seed stage, most of the value is option value not enterprise value. Any approach based on trying to work backwards from some hypothetical future enterprise value will be either incredibly expensive or little more than a guess. But how do you measure a startup’s option value from a practical standpoint?
The second part of our modest insight was to ask, “Is there anyone who has a big stake in accurately comparing the unknown option value to some other known dollar value?” The answer was obvious once we formulated the question: the founders. If the option value of their ownership stake were dramatically less, on a risk-adjusted basis, than what they could earn working for someone else, they probably wouldn’t be doing the startup. Essentially, we used the old economist’s trick of “revealed preference“.
We knew there could be all sorts of confounding factors. But there might be a robust relationship between founders’ fair market salaries and their valuation. So we tested the hypothesis. We looked at a bunch of then current seed-stage equity deals where we knew people on the founder or investor side, or the valuation was otherwise available. We then reviewed the founders’ LinkedIn profiles or bios to estimate their salaries.
What we found is that equity valuations for our chosen segment of the market tended to range from 2x to 4x the aggregate annual salary of the founders. The outliers seemed to be ones that either (a) had an unusual amount of “traction”, (b) came out of a premier incubator, or (c) were located in the Bay Area. Once we controlled for these factors, the 2x to 4x multiple was even more consistent.
Now, the concept of a valuation multiple is pretty common. In the public markets, equity analysts and fund managers often use the price-to-earnings ratio. For later stage startups, venture capitalists and investment bankers often use the revenue multiple. Using a multiple as a rule-of-thumb allows people to:
- Compare different sectors, e.g., the P/E ratios in technology are higher than in retail.
- Compare specific companies to a benchmark, e.g., company X appears undervalued.
- Set valuations, e.g., for IPOs or acquisitions.
Obviously, 2x to 4x is a big range. The next step was to figure out what drives the variance. Here, we relied on the research nicely summarized in Sections 3.2-3.6 of Hastie and Dawes’ Rational Choice in an Uncertain World. In high-complexity, high-uncertainty environments, experts are pretty bad at making overall judgements. But they are pretty good at identifying the key variables. So if all you do is poll experts on the important variables and create a consensus checklist, you will actually outperform the experts. The explanation for this apparent paradox is that the human brain has trouble consistently combining multiple factors and ignoring irrelevant information (such as whether the investor personally likes the founders) when making abstract judgements.
So that’s what we did. We asked highly experienced angels and VCs what founder characteristics are most important at the seed stage. (We focused on the founders because we had already determined that predicting the success of ideas this early was hopeless.) The most commonly mentioned factors fell into the general categories you’d expect: entrepreneurial experience, management experience, and technical expertise. Going to a good undergraduate or graduate program were also somewhat important. Our experts further pointed out that making initial progress on the product or the business was partly a reflection on the founders’ competence as well as the viability of the idea.
We created a checklist of points in these categories and simply scaled the valuation multiple from 2x to 4x based on the number of points. Then we tested our formula against deals that were actually in progress, predicting the valuation and comparing this prediction to the actual offer. This initial version performed pretty well. We made some enhancements to take into account location, incubator attendance, and the enterprise value of progress, then tested again. This updated version performed very well. Finally, we used our formula to actually make our own investments. The acceptance rate from founders was high and other investors seemed to think we got good deals.
Is our formula perfect? Far from it. Is it even good? Truthfully, I don’t know. I don’t even know what “good” would mean in the abstract. Our formula certainly seems far more consistent and much faster than what other investors do at the seed stage. Moreover, it allows us to quickly evaluate deal flow sources to identify opportunities for systematically investing in reasonably valued startups. These characteristics certainly make it very useful.
I’m pretty confident other investors could use the same general process to develop their own formulas, applicable to the particular categories of startups they focus on—as long as these categories are ones where the startups haven’t achieved a clear product-market fit. Past that point, enterprise value becomes much more relevant and amenable to analysis, so I’m not sure the price-to-salary multiple would be as useful.
