Evidence Against Climate Model Accuracy
In my previous post, I performed some basic analysis on the predictive accuracy of General Circulation Models. I was pretty surprised that none of the models in the official CMIP5 archive could beat a simple linear extrapolation over a 15-year forecast horizon. They systematically predict too much warming.
While I have a reasonable amount of training and experience in this sort of analysis, it no longer makes up a substantial fraction of my daily work and climate data is only a hobby for me. I certainly could have made a mistake. So I decided to search the peer-reviewed literature for evidence against climate model accuracy. I did not attempt a fair and balanced review. The default assumption already seems to be that climate models are useful for predicting future temperatures. My goal was to determine whether my findings contradicting their accuracy were plausible.
I discovered at least four lines of evidence that the GCMs substantially overestimate the sensitivity of temperature to CO2 :
- A back of the napkin calculation from the official sources of temperature and CO2 increases so far. Based on recorded temperature and CO2 since 1900, a simplistic estimate of climate sensitivity appears to be roughly 1.8 deg C.
- The literature using empirical historical data in a far more sophisticated fashion. Taking past measurements of temperature and CO2, then plugging them into atmospheric physics equations produces sensitivity estimates from 1.5 to 2.0 deg C.
- Statistical assessments of GCM accuracy in reproducing past and present temperatures. Thermometer data from 1992-2012 and balloon and satellite data from 1979-2009 show the models overestimating warming by at least 2X.
- Corrections for publication bias. There is a well known effect where extreme results have a higher probability of getting popularized in journals. When correcting for this bias by including 1000 estimates from 120 articles across the entire literature, the “consensus” sensitivity is 1.6 deg C.
All this evidence converges on a likely range of between 1.5 and 2.0 deg C of warming when doubling atmospheric concentration from a pre-industrial 280ppm to 560ppm. GCMs put the most probable range from 2.5 to 6 deg C (see Figure 3 of this article). So my results seem perfectly consistent with what professional have found. The model estimates most people reference greatly overstate the expected warming. Obviously, less warming implies we should spend less on carbon reduction.
I’ll review each line of evidence in detail and end with some final thoughts.
Back of the Napkin Calculation
Most non-climate-scientists don’t realize that the basic physics of the greenhouse effect implies a sensitivity of only 1.2 deg C. I certainly did not realize this before I first started digging into the literature in the early 2000s.
Of course, this calculation relies on the kind of implausible idealized model everyone remembers from physics class. In this case, it assumes a uniform surface, with a uniform layer of gases receiving a uniform pattern of sunlight. Wikipedia provides a decent explanation. At one point, I found a Web page companion to an atmospheric physics textbook, and worked through all the math to satisfy myself on this calculation. Yes, for the simplified model, the equations say going from 280ppm to 560ppm produces a 1.2 deg C increase.
However, as usual with basic physics models, the actual Earth is far more complex. The surface isn’t uniform, the atmosphere isn’t uniform, the sunlight pattern isn’t uniform, and the whole thing is spinning–producing a lot of complex dynamics. The temperature increase could potentially be much greater because many other climate processes interact with CO2. Some of the major complications include:
- Warming from CO2 increases evaporation of H2O, which is an even stronger greenhouse gas.
- But water vapor that forms clouds can have a cooling effect.
- Higher temperatures can melt polar ice, decreasing surface reflectivity, and increasing the amount of solar radiation absorbed.
- Higher temperatures can release methane from a variety of sources, which is itself a potent greenhouse gas.
- But higher temperatures and more CO2 lead to greater plant growth, which removes some of the CO2.
- Increased temperatures and ice melting can affect ocean circulation, which strongly influences land surface temperatures.
This article from the Journal of Geophysical Research explains how, even in the presence of some of these complicating factors, the overall response to CO2 remains approximately logarithmic. So increasing the amount of CO2 a given percentage will increase temperature by about the same amount, at least over some range. This mathematical property allows us to do a quick-and-dirty sensitivity calculation.
This graph from a Penn State earth sciences class, based on the IPCC’s Second Assessment Report, nicely illustrates the historical atmospheric CO2 situation:
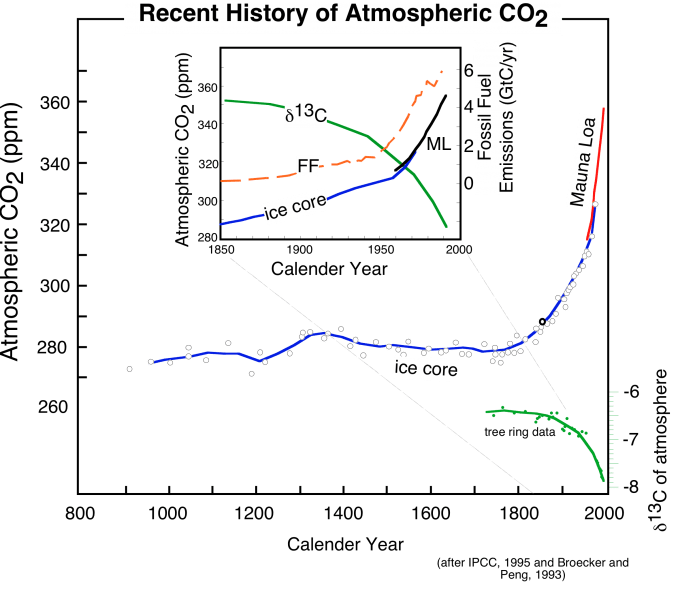
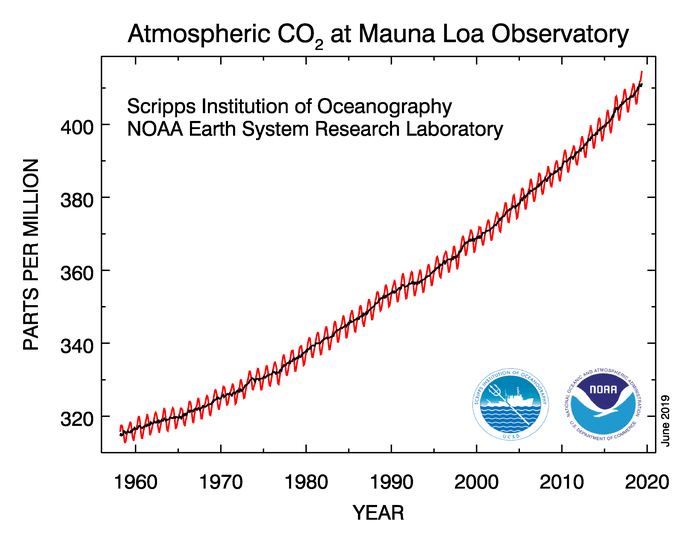
According to ice core data, CO2 started increasing rapidly from its pre-industrial 280ppm in the late 1800s. For current levels, the Manua Loa observatory data from the NOAA shows CO2 hitting 400ppm in about 2015:
We can see the temperature over this period over at Berkeley Earth.
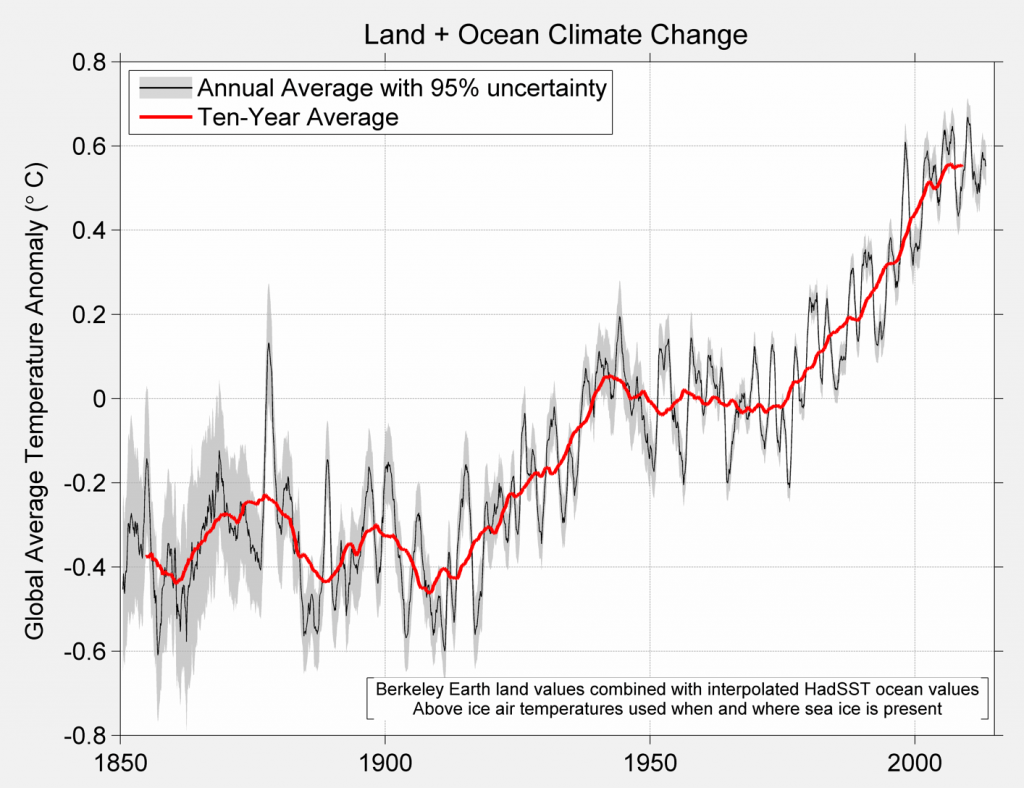
In the late 1800s, average surface temperatures were fluctuating around an anomaly of about -0.35 deg C, before beginning an upward trend. Over recent years, the anomaly has averaged roughly +0.55 deg C, giving us an increase of 0.90 so far.
Now for the logarithmic math. Going from 280ppm to 400ppm is a bit more than a 40% increase. Hitting the doubling threshold of 560ppm would be another 40% increase. So if CO2 were the only factor driving long term changes in temperature, we would expect roughly the same 0.90 increase from the next 40% that we did from the previous 40%–yielding a total sensitivity to doubling of very approximately 1.8 deg C.
Detailed Empirical Estimates
Obviously, my back-of-the-napkin calculation, while based on empirical data, is extremely crude. Unsurprisingly, climate scientists have applied far more sophisticated analyses to this data. But the underlying principle of connecting past temperature changes to past CO2 changes through physics equations remains the same.
Dayaratna et al 2017 summarize the results:
“A large number of studies have appeared since 2010 estimating ECS on long term climatic data (Otto et al. 2013, Ring et al. 2012, Aldrin et al. 2012, Lewis 2013, Lewis & Curry 2015, Schwartz 2012, Skeie et al 2014, Lewis 2016, etc.). This literature has consistently yielded median ECS values near or even below the low end of the range taken from climate model studies. General circulation models (GCMs) historically yielded sensitivities in the range of 2.0–4.5 deg C, and (based largely on GCMs) RB07 yields a central 90 percent range of 1.72–7.14 deg C with a median of 3.0 deg C and a mean of 3.5 deg C (see comparison table in IWG2010, p. 13). But the median of recent empirical estimates has generally been between 1.5 and 2.0 deg C, with 95% uncertainty bounds below the RB07 average.”
Figure 7 from Scafetta et al 2017 does a good job of graphically illustrating this evolution by plotting the estimates of the Equilibrium Climate Sensitivity (ECS) and Transient Climate Response (TCR) to CO2 from research papers vs the year published, from 2000 to 2015.
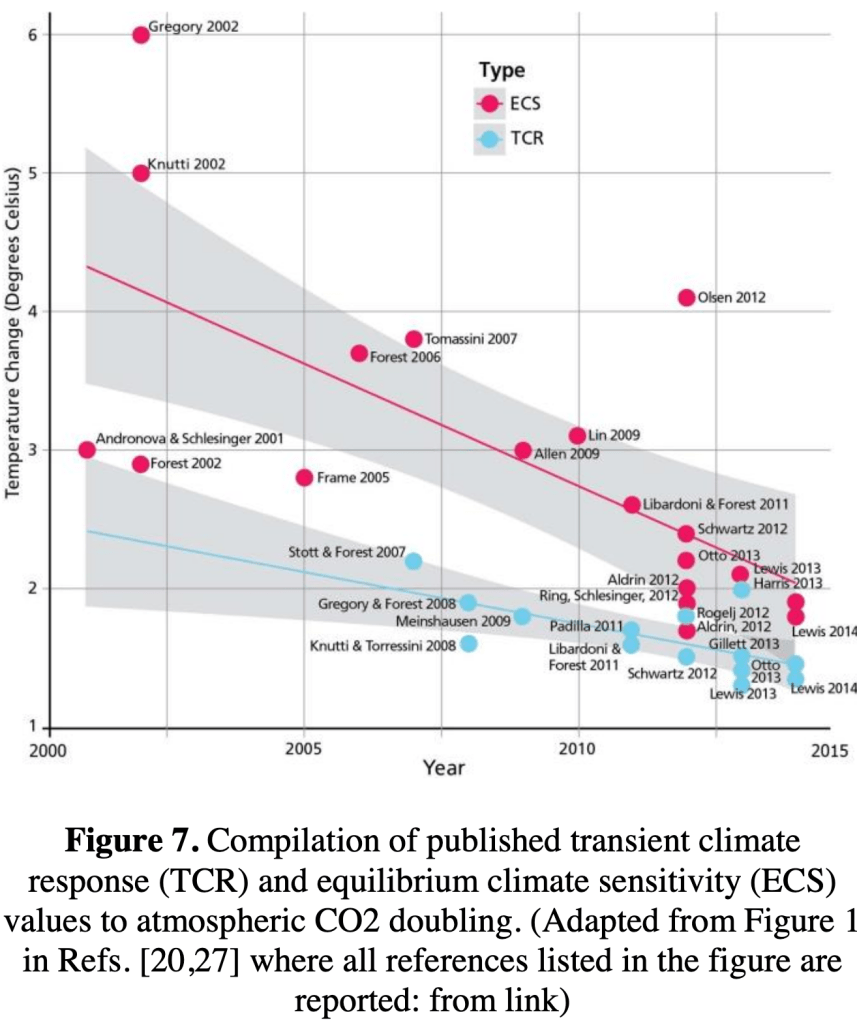
So contrary to popular impressions, the more we have analyzed climate data, the less warming we have come to expect from CO2 emissions.
A note on the sources. Dayaratana works for Heritage Foundation—so is probably suspect to those on the left. Scafetta is a research physicist, formerly at Duke, now at the University of Naples Federico II. He believes solar phenomena explain much of Earth’s warming—so some paint him as a crackpot. But all they are doing here is compiling lists of other people’s work. Any disagreement should be with their characterization of these papers or the literature on empirical ECS estimation in general.
Given the number of papers cited and my skimming of several of them, it seems unlikely that they have substantially misrepresented the content. Now, they may have selectively included only some of the literature, so I will definitely remain open to counterexamples. But as I’ll show in the section on publication bias, the average estimate of 1042 results in 120 different papers is 1.6 deg C. So it seems unlikely that the Dayaratna and Scafetta summaries represent extreme cherry-picking.
Statistical Assessments
Also unsurprisingly, I am not the only one to have analyzed the statistical accuracy of GCMs. At least some of the results from professional researchers line up well with my own.
This comment (which appears to be a summary of this pay-walled paper) has an excellent illustration. When comparing model surface temperatures to the HadCRUT4 surface thermometer data, the actual warming rate from 1992-2012 was 0.14 +/- 0.06 deg C per decade while the CMIP5 model simulations were 0.3 +/- 0.02 deg C per decade. Its Figure 1 clearly shows actual temperature changes falling at the very low end of the model estimates:

The story is the same when looking at the troposphere instead of the surface. This paper found that when comparing the lower troposphere and mid-troposphere temperatures produced by the models to actual satellite and balloon data, the modeled warming rate from 1979-2009 was 2X to 4X the actual.
This whisker plot compares modeled vs actual trends in the tropics for the lower troposphere:

And this one shows the mid troposphere results:

What’s interesting is that the entire evaluation periods in both studies were in the recent past and the present. Recall that the CMIP5 archive is from March 15, 2013. So even when the people building the models knew at least the rough pattern of temperature changes, the models still produced far too much warming. If the GCMs are off by roughly a factor of 2X in the near past, present, and near future (my analysis went through June 2019), it doesn’t seem like we should have much confidence in their predictions for even farther in the future.
I did come across some noteworthy literature trying to defend the models. This article shows that the models perform well if you select a subset of the models whose “natural variability aligns with observations”. And this one shows that they perform better if you “blend” the observed temperatures in a particular way.
But you’re not supposed to make these kinds of post hoc adjustments and claim successful predictions. How many possible selection permutations and measurement corrections are there? Of course some will have better performance. And some will have worse. Only looking at the positive outcomes is not really evidence when we don’t know how many adjustments were attempted. I imagine many climate researchers think figuring out a way of overcoming objections to model accuracy is a promising path towards publication. A fair number probably tried an even larger number of “corrections” and those with “good” results sent those in to journals. These conditions are ripe for the researcher degrees of freedom and forking paths that have produced a “replication crisis” in other fields.
Corrections for Publication Bias
These types of institutional issues in academic research produce a well documented “publication bias”. Large, surprising results tend to be submitted and accepted more often, at least for the most influential journals.
Has anyone looked at factors like publication bias in estimates of climate sensitivity? As it turns out, they have. This blog post takes a detailed walk through two academic papers on this topic . The first paper finds a publication bias corrected estimate of 1.4 to 2.3 deg CO2.
The second paper is titled, “No evidence of publication bias in climate change science.” But as you’ll read in the linked blog post, this title is incredibly misleading. What they actually found was, taking into account 1042 estimates from 120 different journal articles produces an unbiased average estimate of 1.6 deg C. It’s just the top journals and the headline numbers published in abstracts that are biased, not the literature as a whole.
Umm, yeah. The point of using the term “publication bias” is to indicate that people’s perception of the the true situation may be incorrect due to an emphasis on extreme results. If the top journals and the abstracts in other journals emphasize extreme results, the underlying concern is completely valid.
It seems like a a more accurate title would have been, “Strong evidence of publication bias in top climate change journals and climate article abstracts.” Or better yet, “Consensus of 1042 estimates puts climate sensitivity at 1.6 deg C.”
Final Thoughts

- This graph illustrates why using the most accurate climate sensitivity estimates is so important. It’s from a 2017 article by William Nordhaus, winner of the 2018 Nobel Memorial Prize in Economics for his work on climate change impacts. It represents his summary of 38 estimates from 27 studies on climate change impacts. The dots are individual estimates of impacts at various temperature increases. The lines are alternative curves that Nordhaus fits to represent the relationship between temperature change and economic damages. His preferred curve is QREGW, one of several bunched up in the middle.
- As you can see, it makes a huge difference whether the climate sensitivity is 2.5 to 6 deg C as the models indicate, or 1.5 to 2 deg C as other sources indicate. If the models are wrong, then the expected damages from doubling CO2, which will occur in roughly 2100 at current rates, is very small to modest. [UPDATE 9/23/2019: I analyze economic impacts and optimal policy in detail here.]
- In fact, the IPCC has made a huge deal about trying to prevent more than 1.5 deg C of warming. If the models are wrong and the other sources are right, then it actually wouldn’t take much effort to achieve that goal.
- Climate modelers are undoubtedly very skilled and have put a lot of effort into their models. But accurate simulation of complex physical systems is hard. There’s a famous calculation regarding the prediction of collisions between idealized billiard balls on an idealized table. By the time you get to predicting the 56th collision, you need to take into account the position of every particle in the universe. And it certainly seems like the Earth’s climate is more complicated than an idealized game of billiards.
- So given the inherent difficulty of the problem and the potential costs involved, we should insist on fairly strong standards for demonstrating accuracy. What I envision is a committee of climate modelers and independent experts in forecasting from other fields who follow a formal process for agreeing on how to empirically evaluate climate model forecasting accuracy–over the time frames and with the precision required for making decisions about climate change policy. But until we have confidence in the models from that type of exercise, it appears the reasonable estimate of climate sensitivity is only 1.5 to 2 deg C.

Leave a comment