The Truth About Small Seed Rounds
Have you ever finished an arduous task and thought to yourself, “Argh! I went about that all wrong. Why didn’t anyone warn me?” Well, if you’re thinking about raising a seed round, here’s me warning you 🙂
When faced with a challenge, most entrepreneurs seek out as much data as possible, then wade in and start trying to make things happen. For fundraising, that probably means poring over TechCrunch, listening to as many “founder stories” as possible, and dissecting the top VCs’ blogs.
Of course, every one of these channels suffers from massive selection bias–only unusual events are noteworthy enough to make it through their filters. And fundraising is one of those processes where, if you optimize for the unusual case, you hurt yourself in the typical case.
At RSCM, we’ve either observed our portfolio companies raise or directly participated in 100s of seed rounds over the last 4.5 years. We are intimately familiar with the typical case and have developed a corresponding “small seed playbook”. And, should you be lucky enough to find yourself in the right tail of the fundraising curve, there’s any easy upgrade path.
Too Much Money, Obsession with a “Lead”
The most common mistakes in raising a seed round are: a headline amount that’s too large and getting anchored on the concept of a “lead” investor.
Raising seed is rarely easy. But there’s a very steep gradient in difficulty as you move from a $500K to $1M target. In that range, you usually need substantial revenues, a clearly pedigreed team, or anti-gravity class technology. Sure, there’s some chance you could find investors who simply fall in love with you and your idea (most likely if you’re in the SF Bay Area or NYC), but the probability is low and the expected search effort is high.
Even if you satisfy one or more of the extreme requirements, as you get towards $1M, a lead investor becomes more and more necessary. Now, you may be thinking to yourself, “That’s OK; I want a lead!” Hmmm. If you’re an engineer, what would you think if someone said, “I want an architecture with a single point of failure!” Or in marketing, “I want a campaign targeted at users with low conversion rates!” Or in sales, “I want prospects with long sales cycles!” Yes, there are cases where that is in fact what you want, because there are other factors that balance out the obvious drawbacks. But as a rule of thumb, it’s a mistake.
Suppose you plan your round around a lead from the outset. If you don’t end up finding one, you have precisely zero dollars to show for your efforts. Moreover, the universe of lead investors is much smaller than that of all investors, so the prospecting job is correspondingly much harder. Finally, it typically takes a lot longer to get a first serious meeting with a potential lead investor, let alone close the deal. You’re probably in for a much longer fundraising cycle, which has tremendous opportunity cost in terms of building your business, especially at the seed stage.
Unless you truly meet some of the aforementioned extreme criteria, this path is probably not optimal. Our recommendation is that you don’t start a seed raise by looking for a lead unless you have at least $20K in monthly revenues, a dozen professional investors who have proactively expressed interest, or your business simply cannot move forward without a large chunk of capital.
Modest Raise, Brick-by-Brick, Graduated Price
So what do you do if you have zero to small revenues and don’t have a lot of VCs on speed dial? Start with a modest headline amount, $250K to $500K. Your plan will have to show you making decent progress with this amount of money. Make sure your development schedule and cash burn support you hitting a reasonable milestone with that much runway. And be prepared to tighten your belt; fundraising almost always takes longer than expected.
Then get your first commitments from your most enthusiastic supporters and members of their immediate networks. Usually, when I ask a company who is planning or trying to raise if they have anybody close to the company (friends and family, advisor, early customer, etc.) who could write a small check, the answer is yes. When I ask them why they haven’t tried to close the money yet, the answer is usually some combination of, “It doesn’t really move the needle,” and “We don’t know what terms to use.”
At the very beginning of a raise, pretty much no check is too small. You need to get the ball rolling. You also need to show momentum. So use attractive terms that lead to a quick close. I recommend a convertible note with the standard 20% discount and 5% interest, plus a very compelling cap. If you have an attractive valuation, people will not mind so much that you don’t have a lead investor. The plan is to start the cap low and raise it gradually as you build momentum.
Now, a lot of founders worry about dilution and lose sleep over getting “fair” value. Don’t. $100-200K worth of dilution at a valuation even 30 or 40% below what you think is market just won’t make very much difference in the long run–I assure you that there are much worse dilution potholes on the road to liquidity. And fundraising is a terrible distraction from operating your business, so an investor willing to move quickly is valuable.
You must make clear that you’re offering the earliest investors the great deal partly in return for moving quickly (the other part is due to the special relationship and/or value-add of the investor). Otherwise, most investors will dither. Sometimes it helps to tie the great deal to some sort of natural deadline like an accelerator Demo Day, a significant software release, or a large customer close. Creating a sense of urgency is much easier said than done, but you need to try.
Somewhere after $100-200K, you bump the cap up. “The great deal” becomes “the good deal”. The size of the bump depends on what the market tells you. If you closed the first chunk really fast and you have a big pipeline of prospects, bump the cap two notches. If the first chunk was still a fair bit of work or your pipeline seems thin, only bump it one notch. But keep the time pressure on to the extent you can. “The good deal” is also a limited time offer, perhaps tied to yet another natural deadline.
Once you have the first two chunks in, you can start to play a little more strategically. Getting half the the round closed often generates psychological momentum. You’ll also have money in the bank, which helps your negotiating position. And you’ll hopefully have made further engineering and customer progress, which makes you less risky. You can bump the cap again. You can also start trying to work AngelList and look to bigger geographies like San Francisco or NYC (if you’re not based there already). You can event start seriously probing small funds who lead rounds. This is where the upgrade path comes in.
Sidebar: Process Is Key
Before I get to upgrading a small seed round to a big seed round, I need to make a point about process. Like achieving any other company objective, fundraising works better if you impose some structure on it. You absolutely must track prospects, either in a spreadsheet or a CRM.
I recommend a couple of prospect categories: first checks, second checks, later checks, and round leads. Initially, focus on developing lists for the first two categories. You will also naturally generate names of people within your network that fall into the second two categories, but don’t devote too much energy to extending those lists until you’re ready to actively pursue those categories.
Now, start talking with all the first check prospects, focusing on two initial objectives. First, qualify each prospect. There are three basic qualification states: (1) does in fact appear to be a potential first check writer, (2) doesn’t appear to be a first check writer but may be a second or later check writer, or (3) doesn’t appear to be a check writer at all.
Second, try to expand you lists through the prospects’ networks. Ask class (1) prospects if they know anyone else who is as decisive as they are or investors that tend to follow their lead. Ask class (2) prospects if there’s anyone who they like to follow or people they typically participate alongside. In my experience, members of class (3) rarely make good referrals.
After you work through the first check prospects, move on to the second check ones, with parallel qualification and list expansion objectives.
If you have time during the first check and second check prospecting, do some modest scouting of the later check and round lead prospects. Go ahead and schedule some first meetings. These prospects probably have long scheduling lead times and require multiple stage-setting meetings anyway. The goal here is not to close them (though if they fall in your lap, seize the opportunity). Rather, the goal is gather intelligence on what they’re looking for and start building a relationship. Try to keep detailed notes in whatever tracking system you use.
Oversubscribe, Entertain a Lead, Convert if Necessary
OK, back to upgrading. Please keep in mind this is no longer the base case. Most no-to-low revenue startups never get to this point.
Suppose first-check demand justified a two notch bump in your cap, second-check demand seems strong even at the higher price, and later-check and lead scouting has yielded a promising pipeline. Further suppose that you’ve made good operational progress in the meantime. If all these stars align, you can attempt the upgrade.
In this everything-goes-smoothly scenario, you should be having lots of positive meetings with later-check prospects. At some point, it may look like you’ve got more “soft-commits” from later-check writers than you have room (assuming you stick to your original target amount). Or you may receive strong buying signals from some of your lead prospects. If either of these conditions are true, do one of two things:
- Force a quick close and oversubscribe if desired. Tell all interested investors that it looks like you might be oversubscribed. Make it clear that you need to get firm commitments so you can figure out if there is any room left. In other words, use scarcity and social proof to get investors to move. You can then decide whether you want to raise a larger amount than your original target.
- Move to close any viable professional funds as “leads”. The term “lead investor” is confusing. You naturally assume they come first. In $1M+ rounds they usually do, but in seed rounds they often just take everything left at the end. A situation that often arises is you’re talking to a potential “lead” investor that only writes $250K+ checks, but moves very slowly. At the same time, you have several later check writers that you feel you can pretty quickly and you probably don’t have room for everyone. In this situation, you need to force the action with the potential lead investor. Give them a deadline and tell them you need a term sheet in 7-10 days or you will close your existing pipeline. Absolutely do not risk losing other investors because you want to hold out for the “lead”. When you are a low revenue company, always take the bird in the hand.
The goal in both cases, obviously, is to create a sense of both scarcity and urgency. As a low revenue startup you rarely have leverage when fundraising. Anytime you do find some, use it
Most institutional investors these days are comfortable leading a seed round with a convertible note structure. There are still a few that have a strong preference for priced rounds. If you run into one that insists on a preferred equity financing and you’ve already close a bunch of investors on notes, don’t sweat it. You can always convert all the other notes into the preferred round.
Parting Wisdom
Remember, it’s usually pretty easy to adjust and pivot when things go better than expected. So you don’t need to plan much for those scenarios. This playbook is targeted at the usual case. Oversubscribed and led seed rounds are the exception rather than rule.
Depending on market conditions, I would say only 10-20% of seed rounds are “led” in any meaningful sense and another 10-20% are oversubscribed from a modest original target. So 60-80% are just ordinary, every day seed rounds that take a while to close and have no real lead investor. Which is totally fine. Fundraising is really hard. $250K to $500K is a win. That’s roughly a year of runway and I’m continually blown away at what entrepreneurs manage to accomplish in a year.
Your Pitch Deck Is Wrong
I see a lot of pitch decks. Hundreds per year. Almost every one is wrong. Not the startup idea. Not the slide layout. Not the facts per se. But which facts and in what order. Nearly all founders use a structure guaranteed to kill their “conversion rate”.
The common flaw stems from a fundamental mismatch in the way our brains create versus consume content. Each engages a different forms of reasoning. I studied this general topic in graduate school under one of the pioneers in the field. I kept up with the literature over the years. And I observed a huge number of pitches. But it still took me years to realize what was happening (repeating the same mistake in my own pitches, of course). Once I did, I couldn’t help appreciating the ironic beauty of the situation.
First, some background in cognitive psychology. Your brain has two completely different reasoning systems. System 1 is the fast, associative pattern-matching module—good for sitting in the background while you walk the plains and then rapidly determining whether a rustle in the bushes signifies mortal danger or a tasty dinner. System 2 is the slow, logical alternative-weighing module—good for deliberately figuring out whether it’s best to make camp by the river or on the hill. (If you want the full general audience explanation of System 1 and System 2, read Thinking Fast and Slow by Daniel Khaneman, who was the partner of my late professor, Amos Tversky.)
Now, when you build a pitch deck, you have to call on System 2 to develop the content. System 2 is logical so you can’t help but try to construct a deductive proof of why someone should invest in your company. That’s why most pitches have 3-7 slides setting the stage: here’s the problem, here’s the size of the problem, here are the current solutions, here are the drawbacks of current solutions, here are the requirements for a better solution…” I refer to this pattern as “In the Beginning”.
However, when investors consume that pitch deck, either at Demo Day, in an email, or face-to-face, they call on System 1. For most people in most situations, System 1 is the default. System 2 takes much more energy and operates much more slowly, so it only gets called on when something special happens. Thus, unless your pitch quickly triggers investors’ System 1s to recognize your company as a tasty dinner, their System 2s will never wake up and no amount of logic can help you. And then when you use your System 2 to try and improve your pitch, you’ll be blind to the problem.
You may be wondering why none of your advisers notice this problem when they reviewed your deck or watched a practice pitch? Here’s another ironic bit. People who sincerely want to help with your pitch will expend the effort to use System 2, also blinding them to the lack of System 1 appeal.
Perhaps the worst case of “In the Beginning” I’ve seen was at a pitch event several years ago with a brutal schedule of 12 fifteen-minute slots. A company in the last hour really started at the beginning: the last generation of technology, quotes on recent shortcomings of that generation, market sizing for the next generation, the founders’ previous experience designing this type of system, technical architecture of their new solution, and performance metrics versus the primary incumbent. Logical, but not engaging. Ran over his time and had to rush through the last slide, which was something along the lines of logos for 5 blue chip enterprise customers, an average annual contract value of $60K/year, and current $MRR of $35K/month with 20% MoM growth for 6 months.
WTF? By the time that slide flashed on the screen, 80% of the audience members were fiddling with their cellphones or chatting with their neighbors. Talk about a missed opportunity! Better to just show that last slide, drop the mike, and walk off the stage!
Luckily, identifying the problem suggests an obvious solution—focus on triggering System 1 to flag you as interesting. So without further ado, here’s Kevin’s “Hey, tasty dinner right here!” pitch template:
- Title Slide
- Context Slide: super high-level explanation of what you do, 5 bullets max
- BOOM! Slide: the most impressive thing about your company
- Ask Slide: what the next BOOM will be and what you need to get there
- Why Slides: details on how you made the first boom happen and why you’ll make the next boom happen too
Putting the Ask right after the Boom is key. The Boom triggers alertness and primes for action. Then you’ve got to give the investors something to pursue. Otherwise, you may lose their interest. Also, telling them about good stuff that will happen in the future right after good stuff that has already happened in the past naturally gives your good-stuff-forecast more credibility. Your investment ask will seem maximally reasonable at this point.
You may wonder why you need the Why slides at all? Well, once you wake up System 2, it needs to eat too. But keep the Why section as small as possible. The more facts you present, the more chance that System 2 will find a strong objection and dismiss you so it can go back to sleep—remember, System 2 requires a lot of energy. The goal is to just satisfy System 2 and get to the next step in the process. where you can bring other cognitive mechanisms into action. Oh, and when delivering the Why, keep referring back to the Boom as much as possible to maintain alertness. For example: “[Supporting Evidence]… which is why X customer loves us so much and is paying us so much money.”
My guess is that most founders’ pitch decks already contains 80%+ of this content. It’s just in the wrong order and probably too much detail on Context and Why. The big question you probably have is, “What should my Boom be?” Sorry, no blanket advice here. It’s situation dependent. But guess what? By simplifying the problem to one question, we’ve made it amenable to A/B testing. If your Boom isn’t obvious, generate 3-7 alternatives and test them against several investors each. Also, if you can’t come up with a decent Boom, it might be a signal that you haven’t made enough progress to fundraise with much success. So your near term goal becomes to make something Boom-worthy happen.
That’s my preliminary diagnosis and treatment. I’ve given this advice face-to-face to many startups over the past two years and have received a lot of positive feedback. But it’s an inherently limited sample. So if you read this post, try out the approach, and learn anything interesting (positive or negative), please drop me a line and let me know! Maybe someday we’ll be able to develop a thoroughly researched system of Evidence Based Pitching (EBP).
Minimum Viable Investor Updates
For pre-seed and seed stage startups, investor updates are a challenge. Often, founders try to make them too ornate and end up getting behind. Similarly, investors don’t always have the time to fully digest a finely crafted narrative and lose track of what’s happening.
At RSCM, our portfolio of pre-seed and seed-stage investments is at about 400 today, so we have lots of experience with updates. Not only do we read them all, we write a 3-7 line internal summary and each one goes into our CRM system so we have a complete history at our fingertips.
In my opinion, useful investor updates have three requirements: they must get done, they must be easy to produce, and they must be easy to consume.
Anatomy of an Update
You can deliver on all three requirements by breaking updates into modules and putting the most important modules first. That way, you need only produce the modules you have time for and we need only consume the modules we have time for. Everybody wins.
Here are the modules and order I recommend:
[Company Name] Investor Update for Month Ending [Last Day of Month]
- Metrics
- Highlights (Optional)
- Asks (Optional)
- Thank Yous (Optional)
- Commentary (Optional)
Notice that the only required module is “Metrics”. This should be easy to produce because, at any given moment, you should have a handful of Key Performance Indicators (KPIs) you track anyway. This should be easy to consume because most investors have lots of experience absorbing tabular business data. This should be easy to get done because, in our modern software-driven world, KPIs are at your fingertips. Most importantly, if they are the metrics you are actually tracking to run your business, then they will be reasonably informative to investors. Requirements satisfied!
More detail on metrics in a minute, but first some quick notes on Highlights, Asks, and Thank Yous. If you opt to include these modules, do them as bullets. Easier to produce and easier to consume. But, as with PowerPoint slides, no more than 7 bullets per section! Even then, only go to 7 on rare occasions. No more than 5 most of the time. It’s easy for people to get saturated and when they get saturated, they flush the entire list from their attention. If you’ve got more to say, put it in the Commentary.
Everything after Metrics really is optional. Better to get the update out the door quickly than wait until you come up with points for every section. If you ever find yourself thinking something like, “I’ll crank out the Asks later,” stop! Just hit send. Then if you do think of important items later, put them in a notes file and include them in the next update. Or send out a specific Asks email.
Universal Metrics
Now for some depth on metrics. There are really two types: (1) those that are universal to all pre-seed/seed startups and (2) those that are particular to your business. Investors need both. The first type gives us a general sense of how things are going for you relative to the typical startup lifecycle. Kind of like the vital signs that all doctors want to know regardless of patient or condition. They help us triage our attention. So start with them:
- Revenues: [revenues | date when you plan to start selling] (+/- ?% MoM)
- Total Expenses: [expenses] (+/- ?% MoM)
- Net Burn: [total revenues – total expenses] (+/- ?% MoM)
- Fundraising Status: [not raising | planning to raise | raising | raised]
- Fundraising Details: [how much, what structure, valuation/cap, who]
- Ending Cash: [last month’s Ending Cash – this month’s Net Burn + this month’s Amount Raised] (+/- ?% MoM)
- Full Time Employees: [FTEs, including founders] (+/- # MoM)
Note 1: we strongly encourage a monthly update cycle. Anything longer means we get data that’s too stale. Anything shorter, and the financial metrics don’t really make sense. Though if you’re part of an accelerator that encourages weekly updates, we’d love to see them. Just make sure we also get the monthly metrics!
Note 2: always put the percentage or absolute month-over-month changes in parentheses next to each entry. It turns out that highlighting the deltas make updates dramatically easier for us to absorb by drawing immediate attention to the most volatile areas.
A couple of quick explanations. Always have a Revenues line. If your product isn’t finished or you aren’t actively trying to generate revenues, just put the target date for when you do plan to start selling. Either piece of information is enormously helpful to us. Also, provide an FTE number that logically reflects the labor resources at your disposal. A full time contractor is a unit of full time labor that you can call on. Two half-time employees are also one unit. An intern may or may not be a unit or fraction of a unit depending on how much time he/she is putting in and whether the output is roughly equivalent to what a regular employee would produce. Don’t exclude people based on technicalities, but don’t pad your numbers either.
Now, some detail about fundraising status. This topic turns out to be pretty important to existing investors. First, it lets us know that you’re on top of your working capital needs. Second, some investors like to participate in future rounds and even the ones that don’t are a great source of warm leads. Third, it makes us feel good to know that other people have or will be validating our previous investment. Here are a couple of example fundraising bullets:
- Fundraising Status: planning to raise in 4Q2015
- Fundraising Details: $750K – $1M Series Seed at a $5M-$6M pre-money from a small fund and/or local angels
- Fundraising Status: raising
- Fundraising Details: $300K – $500K on a convertible note at a $2.75M cap with $175K soft committed from [prominent angel name] and other local angels
- Fundraising Status: raised and raising
- Fundraising Details: $400K closed of a $600K convertible note at a $4M cap from [small fund name], [AngelList syndicate name], and local angels.
Custom Metrics
At any point in time, there should be a handful of top-level KPIs that you monitor to help run your particular startup. Of course, they vary across lifecycle stage, technology area, and business model. Just pick the most important 2-6 and give them to us. Feel free to change them as you pivot and mature.
Here’s an example for a pre-product enterprise SaaS company:
- Projected Alpha Delivery Date: 11/30/2015 (+15 days)
- Alpha Access Wait-list: 47 Companies (+8)
And one for an enterprise SaaS company that recently shipped private beta
- Max Queries/Minute: 1,201 (+29% MoM))
- Outstanding Critical Bugs: 3 (-2)
- Inbound Inquiries: 481 (-17% MoM)
- Qualified Prospects: 19 (+2)
- Paid Pilots: 3 (New Metric!)
And finally one for a consumer Web company in full operation
- Max Concurrent Users: 1,006 (+30% MoM)
- Registered Users: 23,657 (+13% MoM)
- Monthly Actives: 3,546 (+4.5% MoM)
- Users Making Purchases: 560 (+21% MoM)
- Total Purchase Value:$17,993 (+28% MoM)
- CAC: $12.55 (-7% MoM)
That’s it. We estimate that, if you keep your accounting system up to date and use MailChimp, producing an update with metrics and a few extra bullets should take about 15 minutes (with some practice). And you’d be heroes in our book. Well, all entrepreneurs are already heroes. So you’d be superheroes!
Busting More VC Myths With Data
Regular readers know that I’ve been trying to bust the “Seed Bubble” myth for years. In my latest analysis, I show that total seed funding in 2014 was nearly identical to that in 2008, not even adjusting for inflation or economic growth. Over the last year, I’ve encountered several other persistent VC myths that similarly conflict with the data. Given that the seed bubble meme seems to be subsiding (though I dispute talk of a nonexistent bubble “popping”), I thought I’d tilt at some of these other windmills.
Myth 1: Series A Crunch
The easiest target is the myth of the “Series A Crunch”. As far as I can tell, the first mention of this hypothesis was in a November 2011 blog post by Elad Gil. After a year of bouncing around the echo chamber, this November 2012 Pando Daily article by Sarah Lacy was pretty typical: “Everyone — to a person — says it’s a real phenomenon…That means we’re getting a very different ‘nuclear winter’ as a result of industry excesses this time around.”
OK, so let’s look at the data on Early Stage VC dollars and deals from the NVCA. 

Hmm. I’m having trouble seeing much of a “crunch”. Pretty much up and to the right since 2009. Perhaps a slight valuation correction from 2011 to 2012, but deal volume was still going up. Certainly not a “nuclear winter”. Basic version of the myth.. busted.
Myth 2: Seed – Series A Imbalance
But there’s a variant of the Series A Crunch argument that the real problem is a Seed – Series A Imbalance. It’s not the absolute amount of Series A activity, rather there’s an overhang of increased Seed activity that is/will be causing a shortage of Series A down the line. Both the aforementioned Gil and Lacy pieces presage this twist. But this March 2015 Fortune article says it all in the title, “Free-flowing seed capital is giving startup founders a false sense of confidence,” and subtitle, “And it’s causing chaos ahead of the Series A round.”
Now, if you’ve read my Seed Bubble posts, you know that seed capital has not been “free flowing” over the past few years. But even I was shocked at the stark reality when I overlay VC Early and All Seed funding on the same graph.
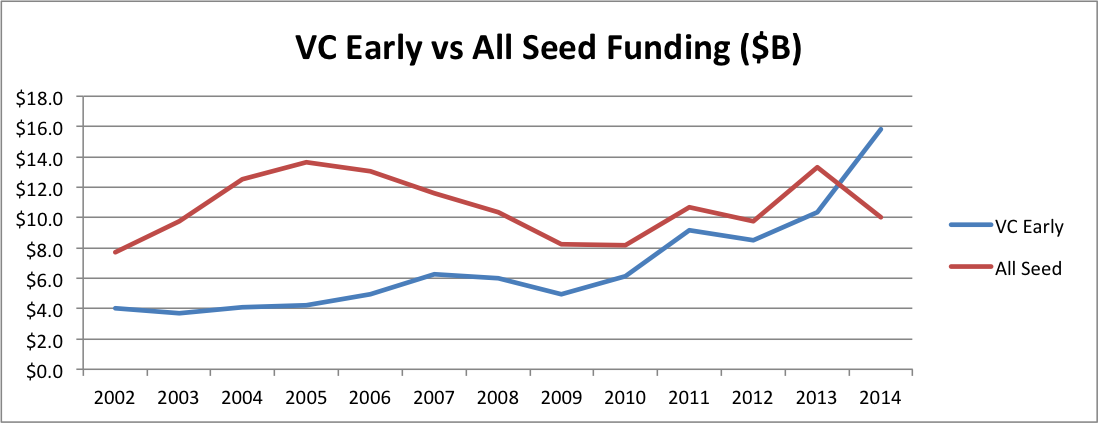
For a long time, seed funding was much greater than VC Early funding–twice the size or more. Then VC Early started to creep up. During the period of the supposed “Series A Crunch”, VC Early funding was actually shooting up from about 10% less to 60% more than All Seed. In fact, the ratio of VC Early to Seed tied the all time high in 2011 when the crunch supposedly began, then nearly doubled that record by 2014. If there’s an imbalance by historical standards, it’s the opposite direction!
Myth 3: “I’m Allocated to Seed”
Obviously, if people managing investment portfolios believe the Series A Crunch or Seed – Series A Imbalance myths, they won’t allocate dollars across startup stages correctly. This trap is compounded by a misimpression of the stages themselves. Many investors believe they are allocated to “seed” when in fact they have only fractional exposure to “something VCs call seed but is vastly different from the rest of the seed market.” From an allocation perspective, misidentifying your asset classes is a huge danger.
In my opinion, what VCs call seed is not the same as the rest of the market. Just look at the average size of a VC deal vs the average size of an angel deal. (Note that the angel number is the average size of at all stages so the graph actually understates the difference at the seed stage; unfortunately, CVR tracks angel deal volume, but not deal size, by stage.)

The ratio rose from about 4X in 2002 to 11.5X in 2014, with a peak of 14.5X in 2009. There’s clearly a categorical difference between what VCs and angels call seed.
Moreover, if you invest in an early stage VC fund, at best a modest fraction of each dollar actually goes to seed. Most early stage VCs make only a small subset of their initial investments at the round they call seed (unsurprisingly, most of the money goes into the round they call “early”). Moreover, even funds who always make their initial investments at what they call seed generally reserve at least $1 of follow-on for each initial $1. So at absolute best, investors who think they have seed exposure through VCs are getting half their dollars exposed to only the tiny slice of the seed market that accounts for the largest deals.
The share of this very high end of the market dropped precipitously in 2011.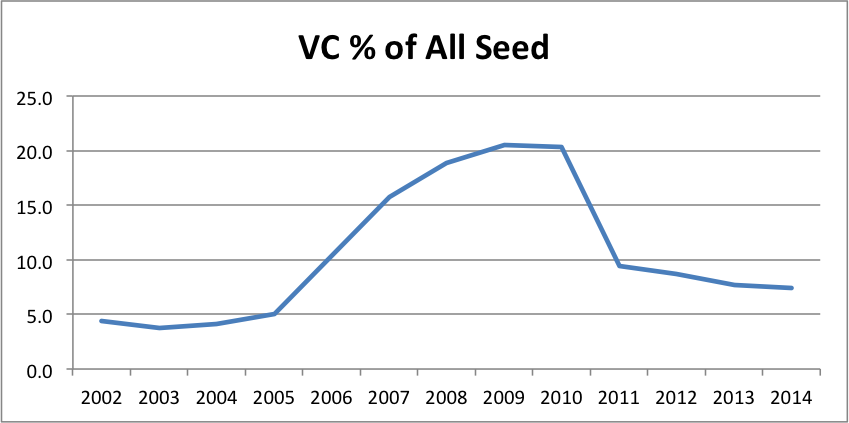
In my opinion, the combination of all these factors means most investors in funds are dramatically under-allocated to over 90% of the seed stage technology startup market–a market that’s roughly the same size as the Early Stage VC market.
Does this difference matter? Well, if you’re worried about portfolio allocation to illiquid assets, you should be pretty concerned about the future liquidity options for such assets. From that perspective, here’s a sobering statistic from CB Insights (secondary source because primary requires registration):
In 2014, 73% of technology companies acquired never took traditional VC.
So if you believe that that VC Seed gets you exposure to the entire seed stage startup asset class, your portfolio will lack exposure to 3/4 of the liquidity options. By the way, this statistic is up from 2/3 in 2013. And with record amounts of cash on the large technology company balance sheets that make these acquisitions, I could easily see this bias growing further. Imagine a portfolio that lacks exposure to 80% or 90% of the liquidity events in that asset class! This third party data dovetails nicely with my previous calculation of a massive difference in the small M&A vs IPO and large M&A market.
I will stipulate that the VC-backed exits are almost certainly each bigger. But the goal of portfolio allocation is to balance out risks within and across asset classes. The data makes it clear that relying on VC Seed leaves a portfolio exposed to idiosyncratic risks within a particularly narrow exit market. So finding some way to target the other 90% of the seed stage technology startup market seems like prudent portfolio construction.
Of course, there may be different data out there or I may have botched the crunching somehow. So as always, feel free to check the work on my spreadsheet.
Full Year 2014 “Seed Bubble” Update
According to my usual data sources, 2014 was not nearly as good a year in seed funding as I would have expected from reading news reports. I was fully prepared to see “bubbly” data. However:
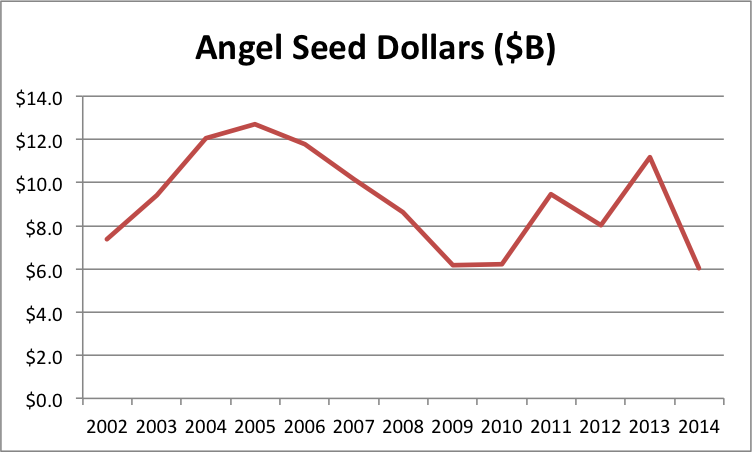
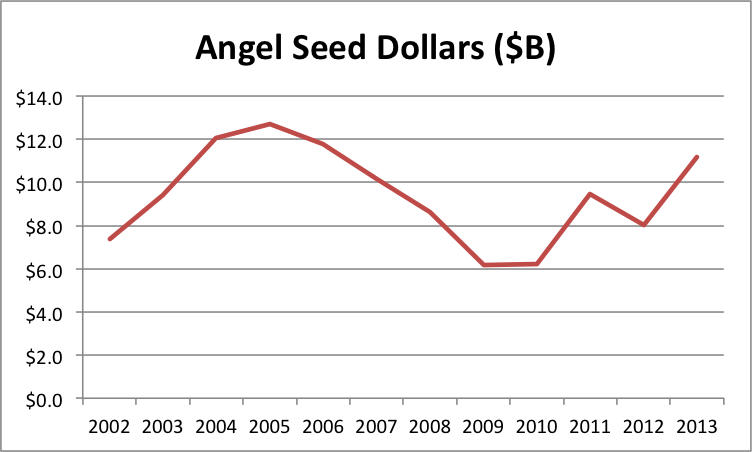
- From angels, seed stage funding plunged nearly 50%, from $11.2B to $6.0B.
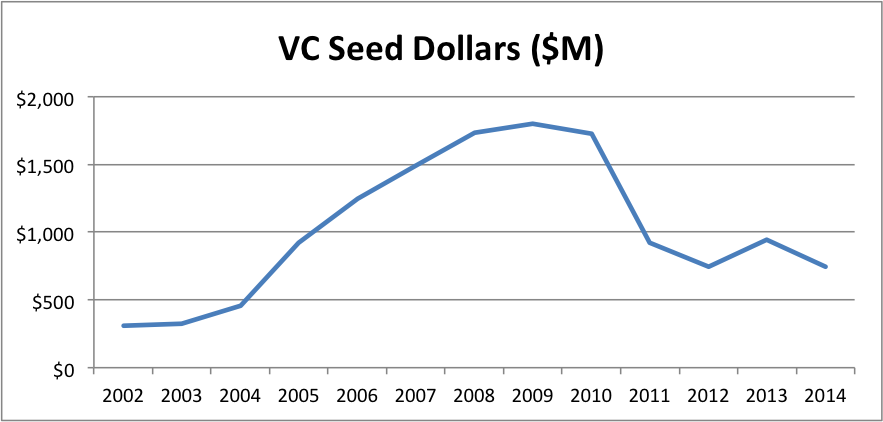
- From VCs, seed stage funding dropped about 25%, from $940M to $740M.
(While VC early stage jumped over 60% and expansion stage spiked over 110%.) - But median seed valuations increased 20%, from $2.5M to $3.0M.
The run up of a bubble does not typically include sharp volume drops, but the price rise may indicate something interesting is going on.
See here, here, here, here, here, here, and here for previous posts in this thread. My data sources are the Center for Venture Research for angel data, the NVCA for VC data, and my personal tracking spreadsheet for “super angel” funds not part of the NVCA. I use the HALO report for pricing data.
Out of concern that one possible explanation for individual angel investments dropping is a shift to angel funds, I reconstructed my angel fund tracking spreadsheet from scratch. I was worried that my list of funds was too haphazard. So I pulled a longer, hopefully more complete, list of micro VC firms from CB Insights. I then removed ones that are members of the NVCA, whose investments should already be included in that data. I also went through fund CrunchBase listings and Web sites, filtering out those who invest primarily outside the US or not at the seed stage. I noted the reason for any such exclusions in my latest spreadsheet. This updated source contains 74 funds totaling $3.2B, while my 2013 source contained 29 funds totaling $1.2B—a substantial increase in coverage. There were also 23 funds on the new list for whom I could not find dollar amounts. However, I assume each fund with dollar amounts is completely deployed in the current year so the total should still be a gracious estimate given that even very fast funds actually deploy over two or three years.
Despite the addition of $2B in covered super angel investments, the 2014 graphs were still sobering with a 25% total volume drop year-over-year:

The big question is how do you get a pronounced volume drop and a pronounced price increase? First, one of the data sources could have a problem. The obvious candidate here is the CVR angel data because it accounts for most of the total volume I track, the methods aren’t documented, and this is its biggest one-year drop ever. According to the latest report, total angel investment volume was only down 2.8%. But the proportion of seed and early investment plummeted from 45% to 25%. I can think of several reasons for a potential measurement inconsistencies here. Note that the 2012 measurement was 35% so it has a lot volatility.
Similarly, the CB Insights pricing data could be the result of an anomaly, as it also experienced its biggest one-year move. In contrast to CB Insights’ 20% jump in valuations, the CVR valuation data showed a slight decrease across all stages (but the CVR valuation data is reported inconsistently, so I have avoided using it in the past). Of course, the CB Insights and CVR data collection methods could somehow result in systematically different samples that explain the conflicting data.
There’s another explanation that I find tantalizing, if only because it would confirm my hypothesis that founder opportunity cost drives the earliest company valuations. Think of seed stage companies as “supplying” investments and investors “consuming” them. Econ 101 says that a simultaneous decrease in volume and increase in price implies that the supply curve has shifted left. It’s like a freeze wiping out a significant fraction of the orange crop. People buy less at higher prices because there’s a shortage. But why would this happen now in the seed stage startup market?
I have a guess: the macroeconomy recovered. Unemployment eased from 7.5% in June 2013 to 6.1% in June 2014. Moreover, according to Indeed.com, software engineering salaries jumped 20% in 4Q2013. All of a sudden, the opportunity cost of founding a seed stage startup went up dramatically. That could definitely have an effect on formation rates, which would show up first in the seed stage funding data. Another “supply side” explanation would be that founders simply need less money to advance their ideas past the seed stage. The total number of angel-funded deals actually went up 3.8% according to the CVR report.
At RSCM, we’ve certainly seen no shortage of quality opportunities at low valuations. If anything, we are deluged. Of course, we purposely focus on smaller deals so we wouldn’t expect to see any shortage if lower capital requirements were the underlying cause. Our experience is also consistent with a data collection anomaly. I’d love to get my hands on a good dataset for accelerator program application volume. That might allow us to distinguish between declines in formation rates and capital requirements.
Bottom line: I’m still very skeptical that there is a seed stage bubble.
Full Year 2013 “Seed Bubble” Update
So there are finally some signs if life in seed-stage technology funding:
- In nominal terms, we roughly equaled the global peak from 2005.
- Seed stage valuations have remained flat since 2011.
- Adjusting for the size of the economy and our wealth, the level is still down.
Kind of hard to call this situation a “bubble”. But I can live with calling it a “recovery”.
Once again, see here, here, here, here, here, and here for previous posts in this thread. My data sources are the Center for Venture Research for angel data, the NVCA for VC data, and my personal tracking spreadsheet for “super angel” funds not part of the NVCA. For super angel investment, I worry most about detecting new chunks of money, not necessarily measuring the “true” level. I use the HALO report for pricing data, which goes back to 2011.
Here are the graphs (spreadsheet here):


It looks like all the components are recovering, though traditional VC somewhat more slowly and super angel somewhat more quickly. The question is still, “Bubble or no bubble?”
Let’s look at prices, as I did in my 1H2013 post. According to the full year 2013 HALO report, the median seed valuation is still $2.5M… just like 2012… and 2011. The 75th percentile valuation is up slightly in 2013, from $3.7M to $4.2M. But the 25th percentile valuation is down a hair from $1.5M to $1.4M. According to the methodology described in the report, this data includes angel group deals before Series A. So what I think is happening is that some companies that might have gone for a VC round in the past are doing a larger angel round instead. If you check out my spreadsheet, you can see that check sizes for what the NVCA calls “seed” have taken another swing up, probably pushing some early startups out of that market. So no obvious pricing pressure.
Moreover, I think the following graphs make a bubble quite unlikely. I’ve been waiting for years to pull these out. The first one “deflates” the seed investment levels by adjusting for GDP. Thus it measures how seed investment has changed relative to total economic output. The second one deflates seed investment levels by adjusting for the level of the S&P500 index (on July 1 of the given year). Thus it measures how seed investment has changed relative to the total stock of wealth.
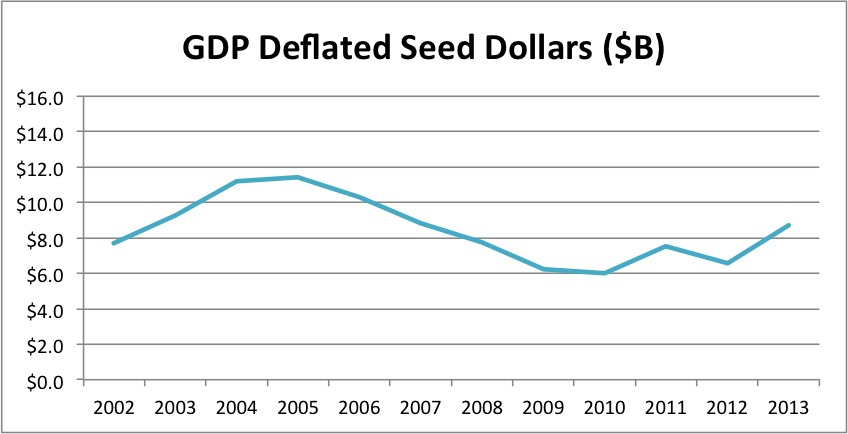

Compared to our economic output and total wealth, seed-stage investment seems like it still has a significant amount of headroom. I’m actually pretty sure I could build a darned accurate forecasting model based mostly on the S&P. Given that the index is up roughly 25% from July 2013 to July 2014, my eyeball estimate is that 1H2014’s numbers will show us somewhere around a $16B annual rate.
Seed Bubble Watch 1st Half 2013
Well, it’s been almost three years since I started watching for quantitative evidence of a “bubble” in seed-stage technology funding. I feel like a broken record saying there’s still no sign. Here are the highlights:
- 1H2013 volume is 30% below the 2005 global maximum
- 1H2013 volume is 10% below the 2011 local maximum
- Seed stage valuations have been flat since 2011
You simply don’t have a bubble when volume is down and prices are flat!
To review the history of my seed bubble watch, see here, here, here, here, and here. Recall that I use the Center for Venture Research’s angel data, the NVCA’s VC data, and my personal list of “super angel” funds not part of the NVCA. The volume calculation methodology is not designed to produce the most accurate estimate of the true number of seed-stage dollars. Rather, I want it maximally sensitive to sudden influxes in new seed money. I use the HALO report for pricing data, which started coming out in 2011.
That said, here are the graphs (spreadsheet here):
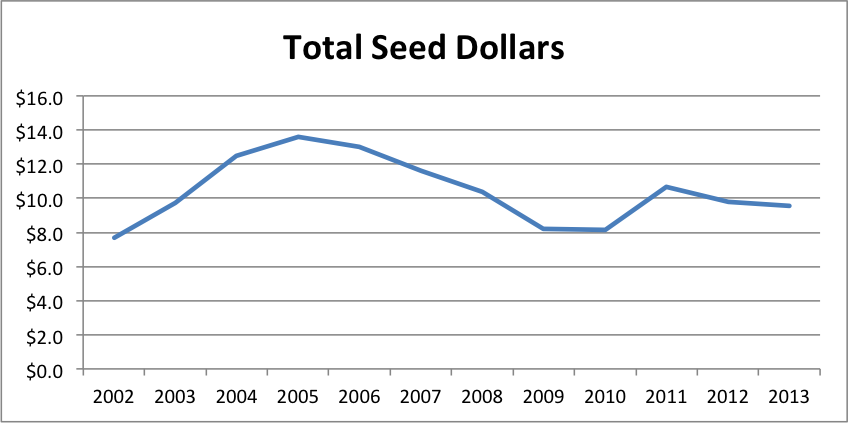


The story continues to be that traditional VCs have become increasingly irrelevant as their seed dollars have dropped 60% from 2009 to 1H2013 and their share of all seed dollars has plunged from 22% to 7.5%.
Angel’s position has gradually eroded from 2011 to 2013, with their share decreasing from 88% to 77%. Super angels and seed funds have gained in share during that time, jumping from 3.0% to 15%. My guess is that trend will continue unless the individual angel pool increases via new platforms like AngelList. In any case, the new breed of funds is not growing fast enough yet to make up for decreases from other sources.
[Edit 8pm: Somehow this paragraph got deleted from my draft.] There also appears to be no pricing pressure at the seed stage. According to the 2012 and 2Q2013 HALO reports, the median seed-stage pre-money valuation has remained $2.5M since 2011. Moreover, the 25th and 75th percentile valuations have actually decreased, making it hard to argue that there is some hidden dynamic masking a buildup in prices.
Interestingly, the HALO report shows a continued drop in California’s share of angel group activity. From 21.0% in 2011, to 18.1% in 2012, to 17.3% in 1H2013. I’ll take this as continued confirmation that RSCM is right that some of the best values are outside the Bay Area.
It will be interesting to see what the data shows for 2H2013 and 1H2014. With the S&P reaching new highs throughout 4Q2013, institutions should increase their allocations to alternative investment funds and angels should feel like they have more wealth to invest in startups. Assuming the public markets don’t experience a sudden drop in the beginning of 2014, of course.
Startups in “Market Space”
While my goal is to eventually apply the Market Space model to large enterprises, I’m going to begin with startups. Obviously, my work at RSCM makes startup close to my heart. And most large enterprises were new entrants at some point, so analyzing the birth of firms seems like it should lay some crucial groundwork. (For previous posts in this series, see here: one, two, three, four.)
Hill Climbing in “Feature Subspace”
Looking at the search for profitable products as a Multi-Armed Bandit (MAB) problem illuminates the general complexity of the firm’s challenge (see previous posts in this series: one, two, three). But in terms of analyzing specific firm behaviors, I think it’s important to acknowledge that we don’t have a pure MAB here. It seems pretty clear there’s more causal structure in Market Space.
“Market Space” as a Multi-Armed Bandit Problem
In the last post, I presented my 30,000-foot view of Market Space. I think it already provides some intuition. From the final diagram, you can literally see the firm’s search problem. But our eventual goal is a more formal model. So we need to drop our altitude a bit.
